

Week 5 2022
The Network Demand Model demands a lot of patience, a commodity in short supply in today’s febrile world. This week, after resting in the off position since May 2021, the MRI signal has turned on. The short-term transaction signal has also turned on, so the NDM moves from 0/6 to 2/6.
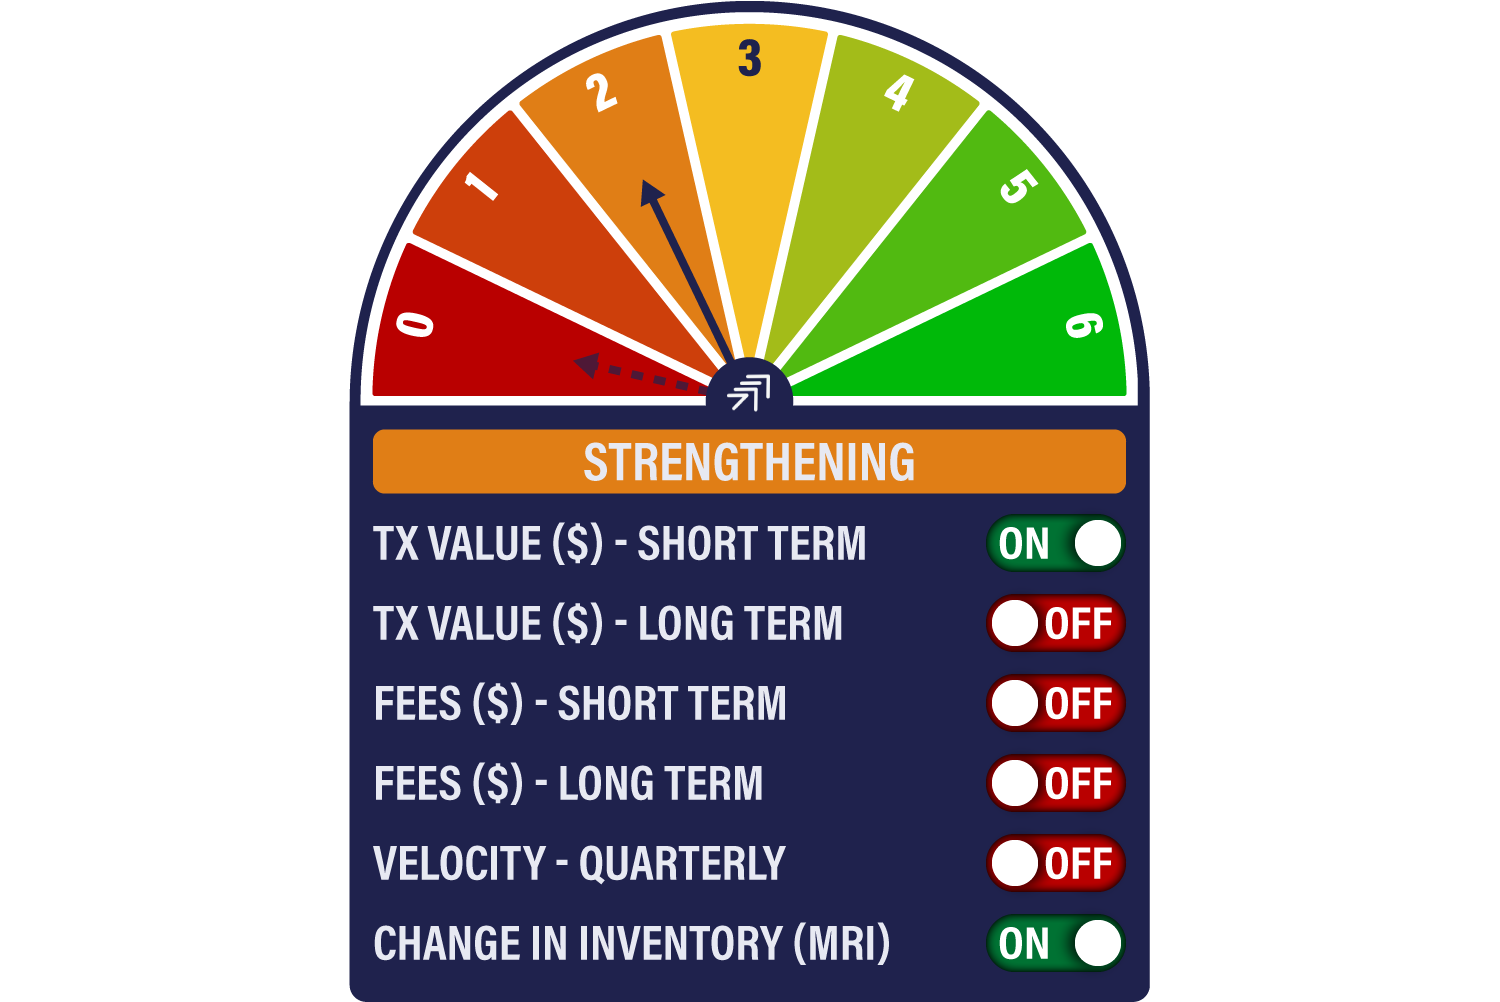
The Miner’s Rolling Inventory (MRI) last turned off on the 4th May 2021 when the price of bitcoin fell from US$57,000 to US$53,000 in a day - this week it turned back on. For all the subsequent market gyrations, being out of the market since then would have been a capital preserving strategy, so it is positive to see it come back on.
We have a contrarian view on the indicator, believing that the miners’ ability to sell more than they are generating is a sign of healthy underlying demand. Many take the opposite view, believing that miner selling is a sign of weakness, presumably because they must know something we don’t.
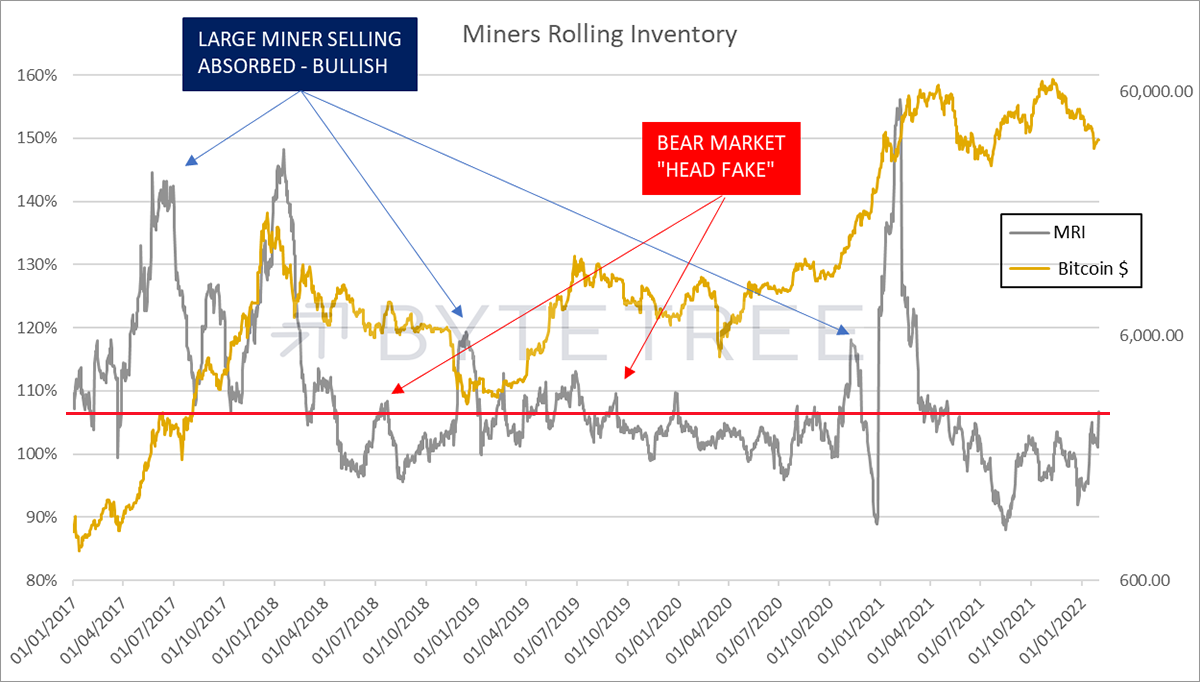
The red line in the chart above denotes the level at which the MRI turns back on. By itself, you can see that MRI alone is not conclusive in terms of establishing a resumption of a bull market, which is why the model requires corroboration from the other on-chain signals. Indeed, the most convincing moves are when a major spike in MRI is absorbed (blue arrows), and we are a long way from that at the moment. The danger is that small spikes are mere “head fakes” in a bear market environment, as shown by the red arrows. In other words, it lures you into thinking things are better when they aren’t.
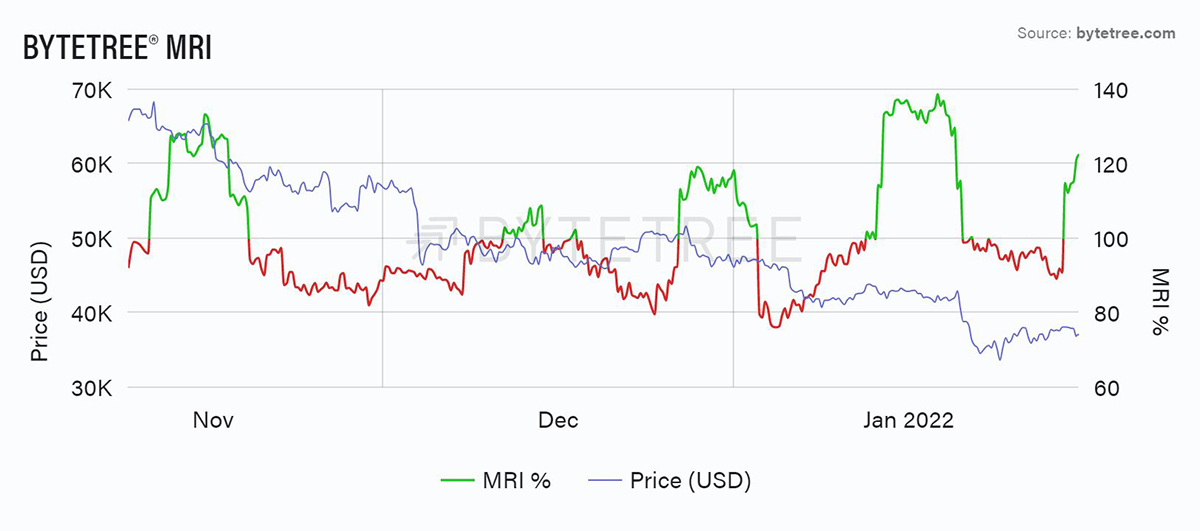
Recently, miner selling has preceded bearish price action as shown in the chart below. Since the all-time high for bitcoin in November, all episodes of miner selling spikes have been followed by further price falls. Thus, until we get confirmation of improved on-chain activity from other signals, it is too early to call for a bull market based on the MRI signal alone.
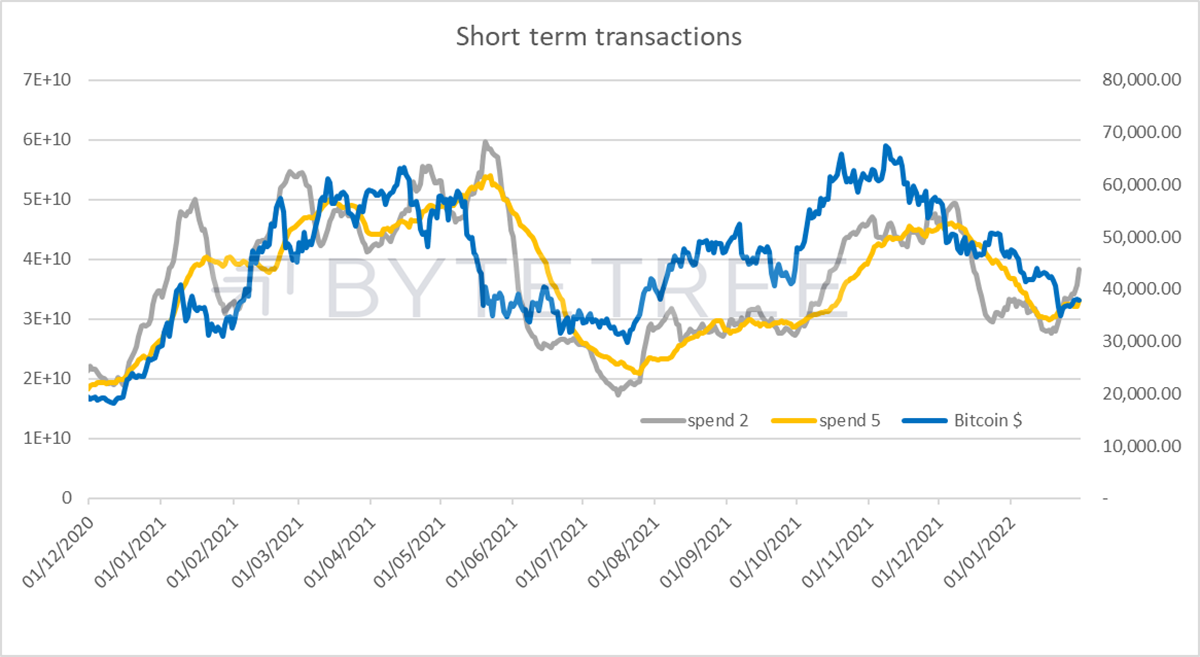
The other signal to turn back on is short-term transactions, as shown below. While this signal is indisputably noisy, sharp divergences have usually been followed by large price moves. The direction of these moves has been related to the pricing level at the time, and it’s generally given a better buy signal than a sell signal. Because we’ve had a large correction from the peak already, this recent move may be interpreted positively.
At the margin, there have been recent improvements across the board in on-chain activity. As can be seen under the “charts” tab on the ByteTree Terminal, both fees and velocity have ticked higher. This is encouraging but not conclusive.
Activity remains heavily dominated by the largest accounts, with the Institutional Demand Ratio (IDR)* continuing to tick higher. The buying opportunity of last year, in July/August, was characterised by a return of the smaller investor, when the IDR dipped below 98.5%. By this measure the current market is supported by institutional traders. The retail investor is yet to be convinced.
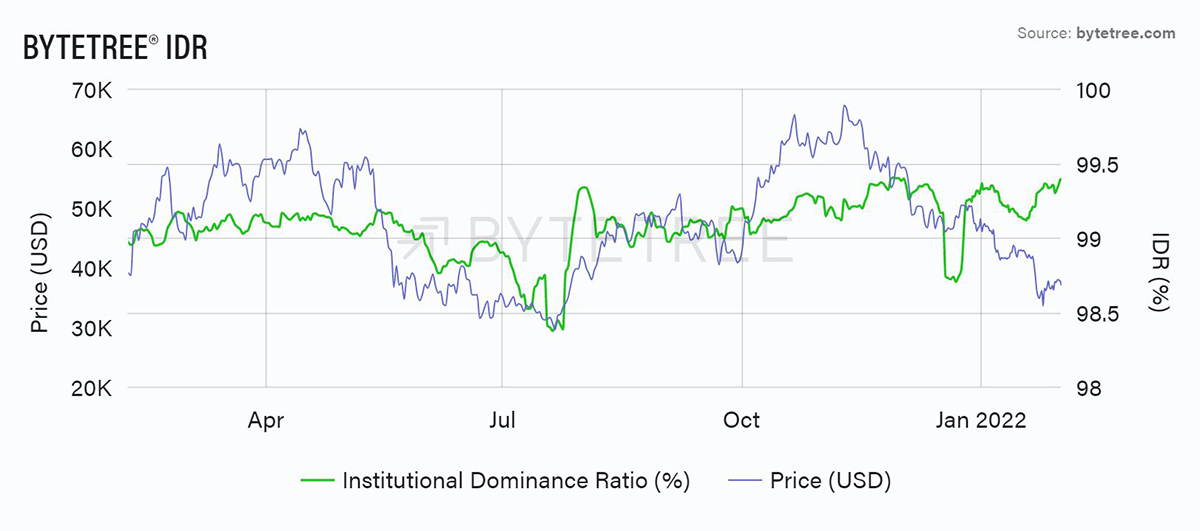
*The Institutional Demand Ratio measures the percentage of on-chain transaction value that is accounted for by the top quintile of trades in terms of size.


