

Week 4 2022
As predicted last week, the long-term transaction signal has now turned off, taking the model to a fully bearish 0/6. Velocity and short-term transactions have picked up, but this can reflect short-term capitulation rather than an underlying improvement in network usage.
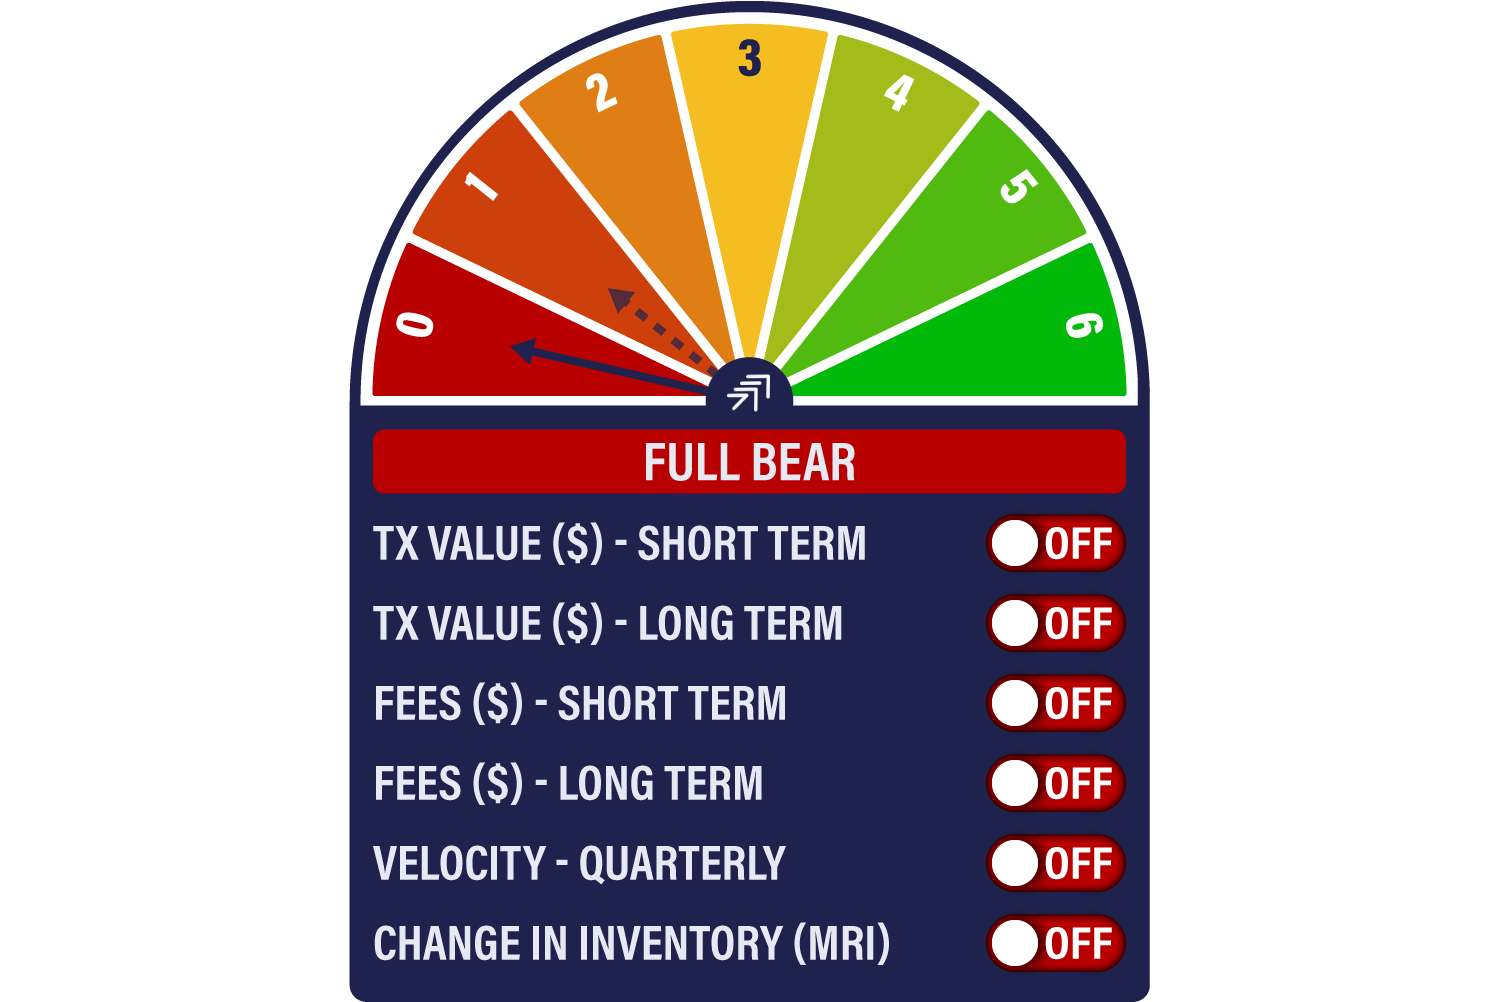
Zooming out, it is notable how good the fee indicators have been at demonstrating network activity on a through-cycle basis. While we’ve seen a recent spike in miner selling, we haven’t seen a marked decline in overall inventory, which again tends to be a feature of a market bottom. With difficulty having spiked, miners might start to feel more pressure to unload as the price declines.
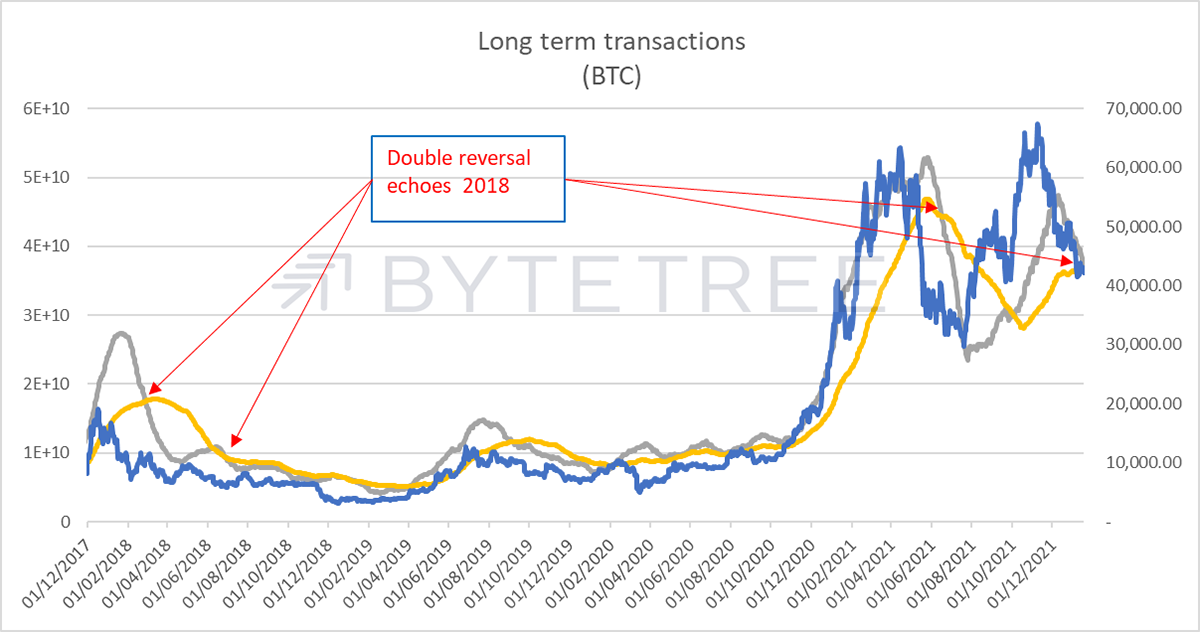
The “double-reversal” of long term transactions has powerful resonances with the 2018 bear market. In 2018 this occurred at a temporary market bottom in July but preceded September’s 40% drop.
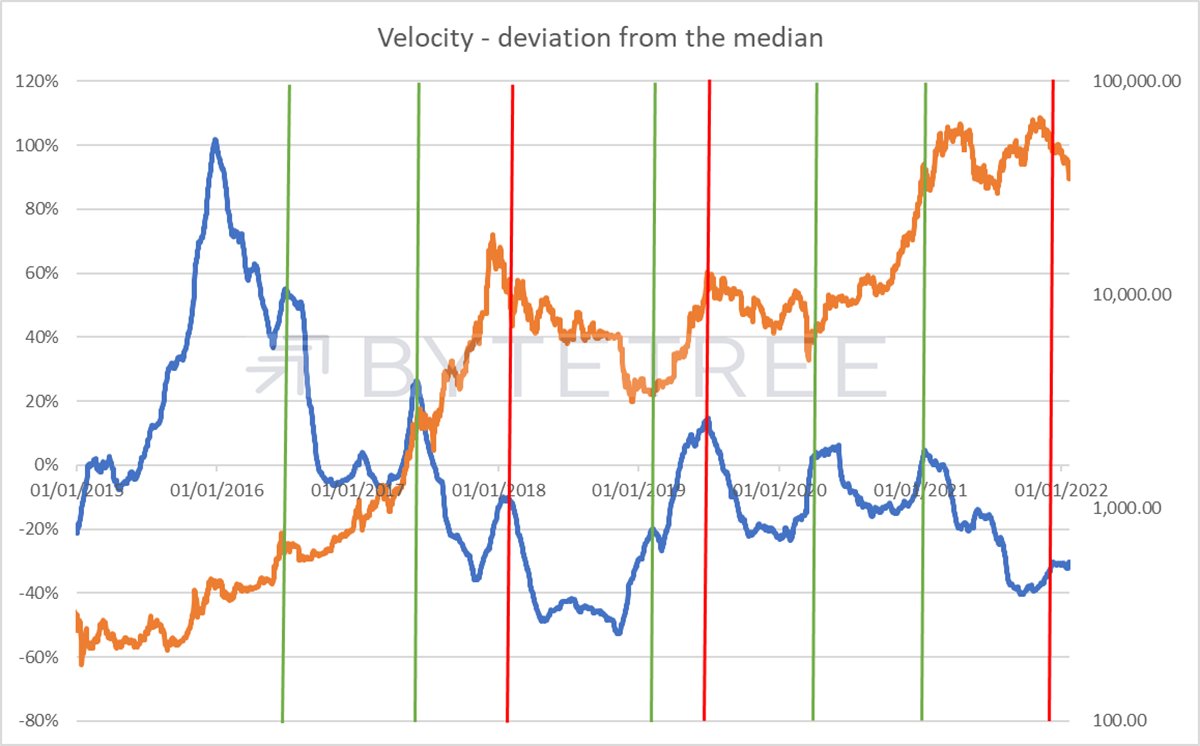
Velocity has picked up substantially in the last few days, as shown by the green line below. Velocity is telling us about the speed at which a coin moves around the network over 12 months, which is an input to our valuation methodology.
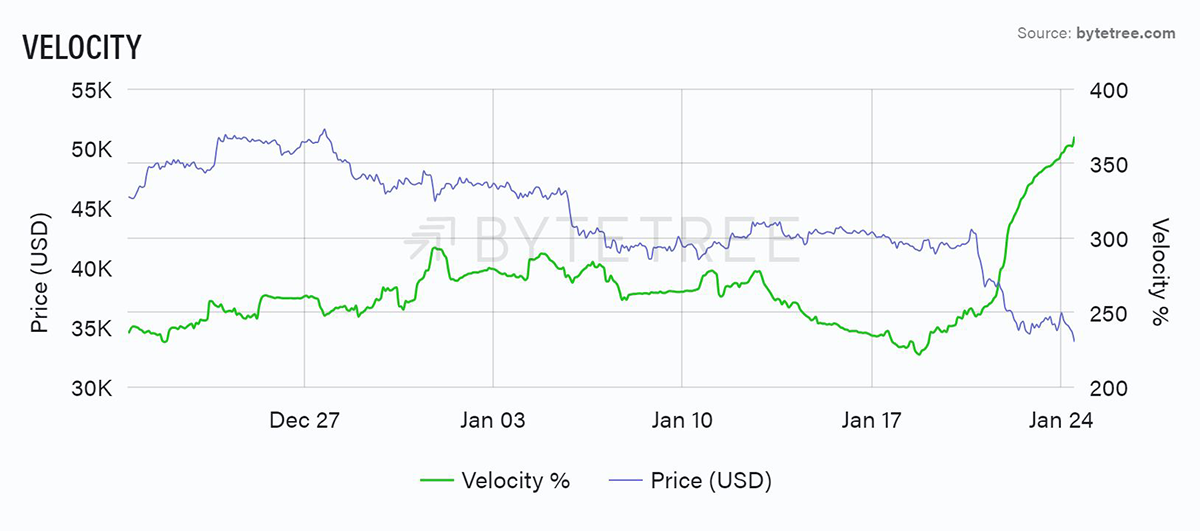
However, if we zoom out to a 1-year timeframe, we can see that at the moment it is just noise.
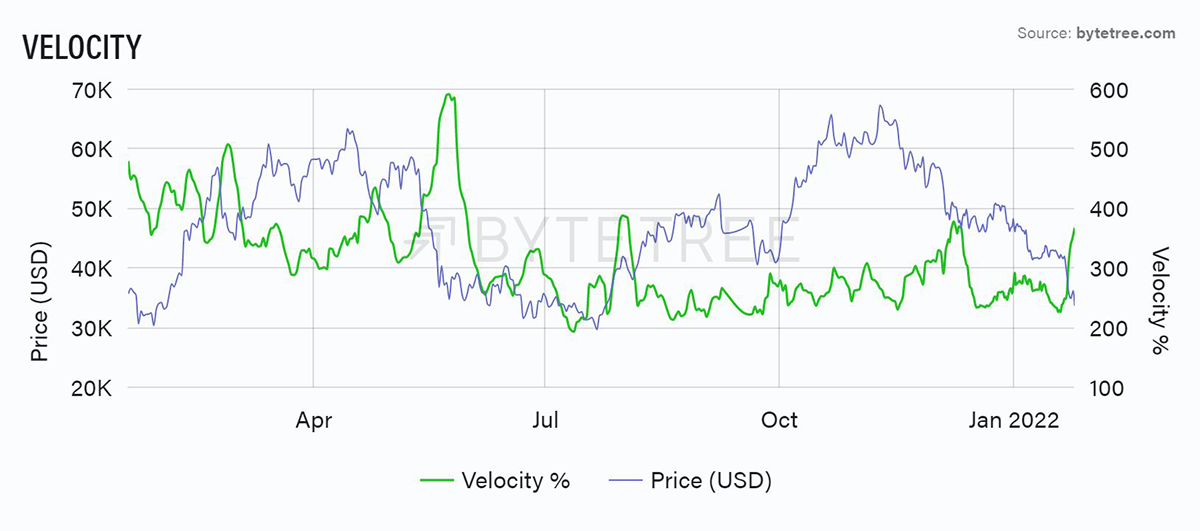
Stepping further back, where we see spikes in velocity (measured by deviation from the 2-year median), it generally heralds a regime change one way or the other. In the chart below, the green vertical lines suggest a positive outlook, the red lines a negative outlook. Given we have no velocity spike to speak of at the moment, it is premature to call a recovery based on this metric. It might be spurious, but we’re looking for patterns. The last line was red.
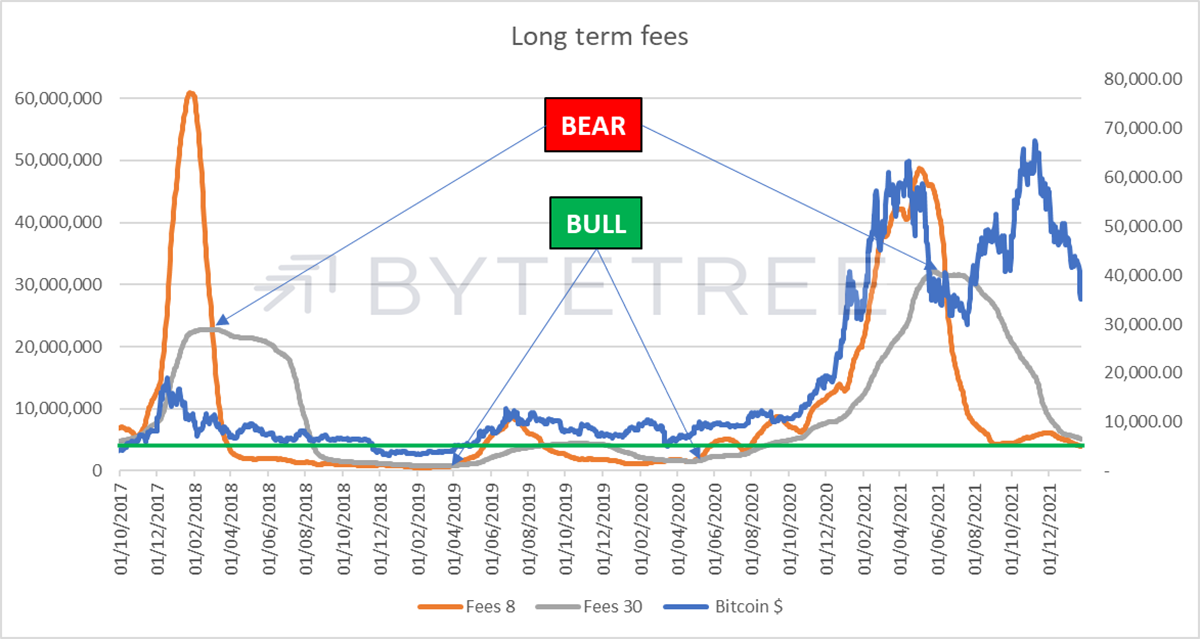
Fees have been a good way to track network activity over the years. The technology has improved, making bitcoin cheaper to transact. Nonetheless, note how low fees have now become - the last time the 8-week line was at this level, the bitcoin price was around US$10,000 (horizontal green line). Fees should be considered as recurring income for miners who choose to HODL bitcoin. As fees decline, those miners will be forced to liquidate, potentially creating a further overhang.
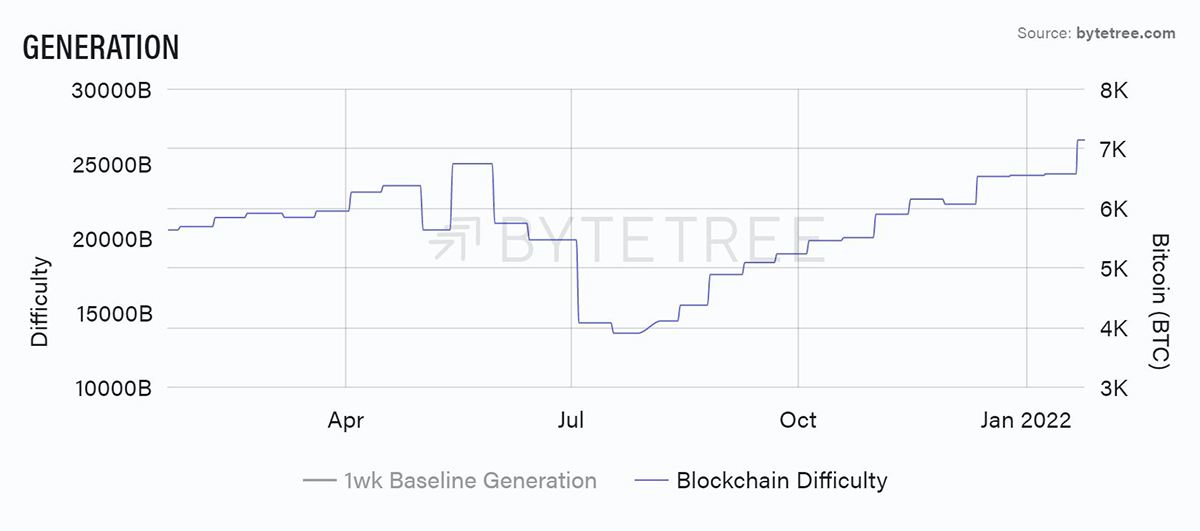
This is especially the case if their costs continue to rise. For that, we can look at “blockchain difficulty”, which tells us how much energy is required to keep block production consistent. As shown below, this is now at an all-time high. Costs are rising, and revenues are falling for the miners. They have had a very profitable run, but life is getting harder.
The overall conclusion from the on-chain data is that it remains much too early to start calling a bottom.


