Week 1 2022
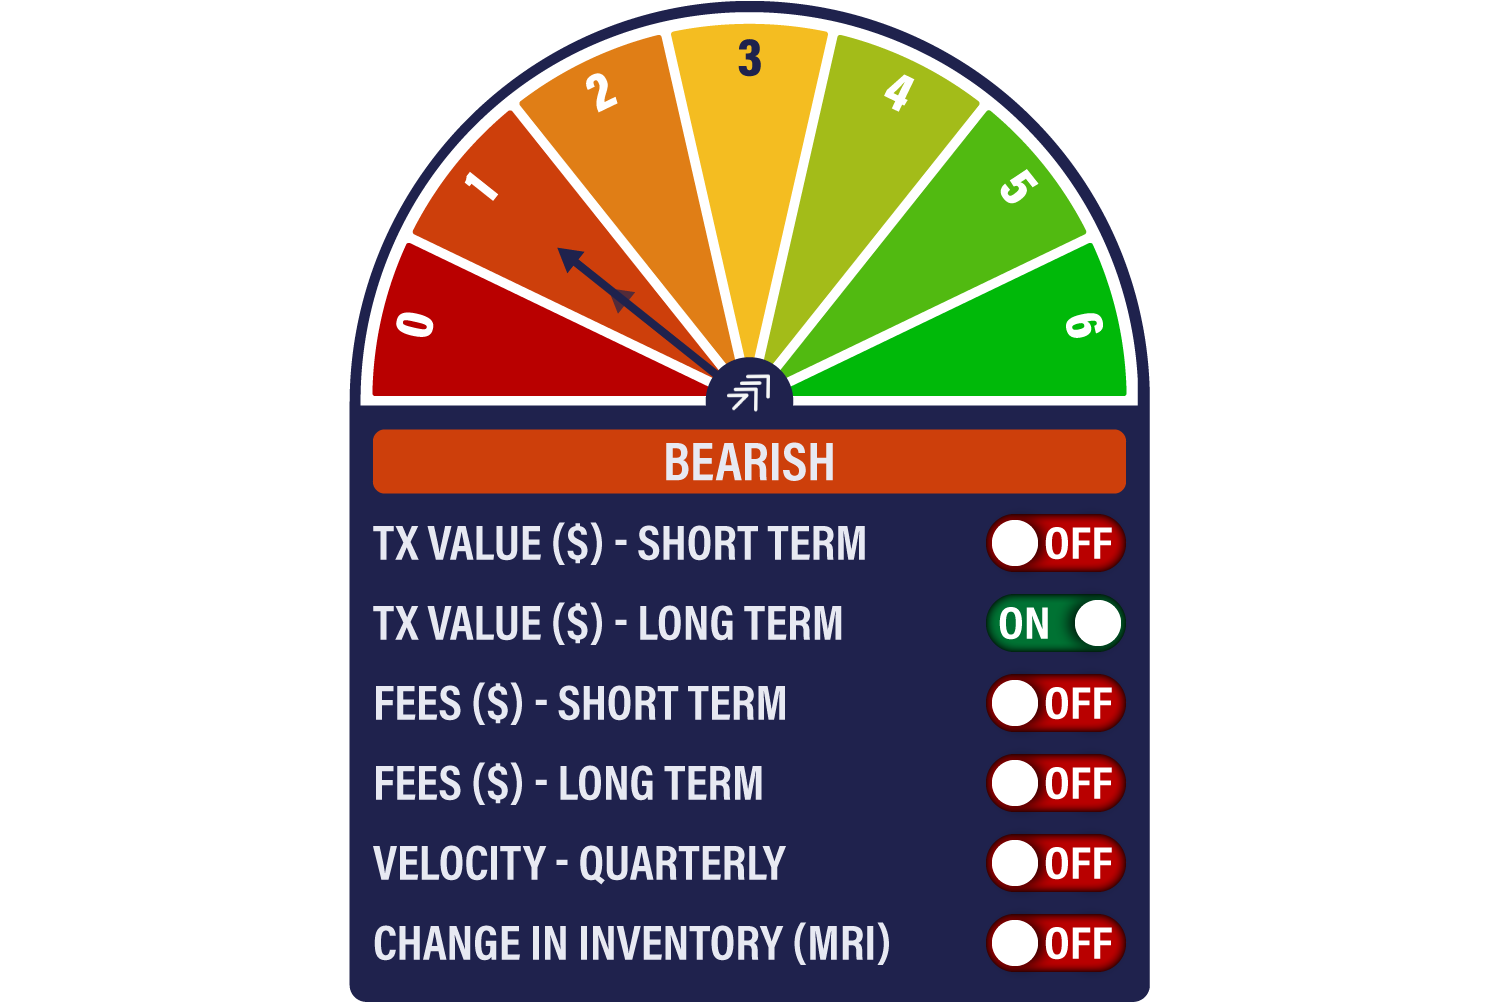
The Network Demand Model starts 2022 in subdued mode, remaining on a score of 1/6. The sole indicator remaining in positive territory is long-term transactions.
In recent weeks, we have commented on how quiet periods of activity may indicate ‘value’ buying ahead of renewed bursts of activity. Observers like to see this as a move of bitcoin from weak to strong hands, or from short-term to long term-holders. But this is far from being a certainty. In the current cycle, it is hoped that the institutional investor becomes the new long-term holder. This lays responsibility for its appreciation in the hands of a group of investors who may not have such a fundamental attachment to the libertarian principles that have underpinned its progress thus far. In other words, there may be a difference between large hands and strong hands.
If history is any sort of guide, there are some unnerving long-term patterns emerging in on-chain activity. One example is the behaviour of fees. These have been a source of surprise to us on a short-term basis, as we might have anticipated a bottoming out by now. Yet they continue to remain weak. While this is in part due to software improvements (Segwit/Taproot), the similarities with the bursting of the 2017/18 bubble are striking.
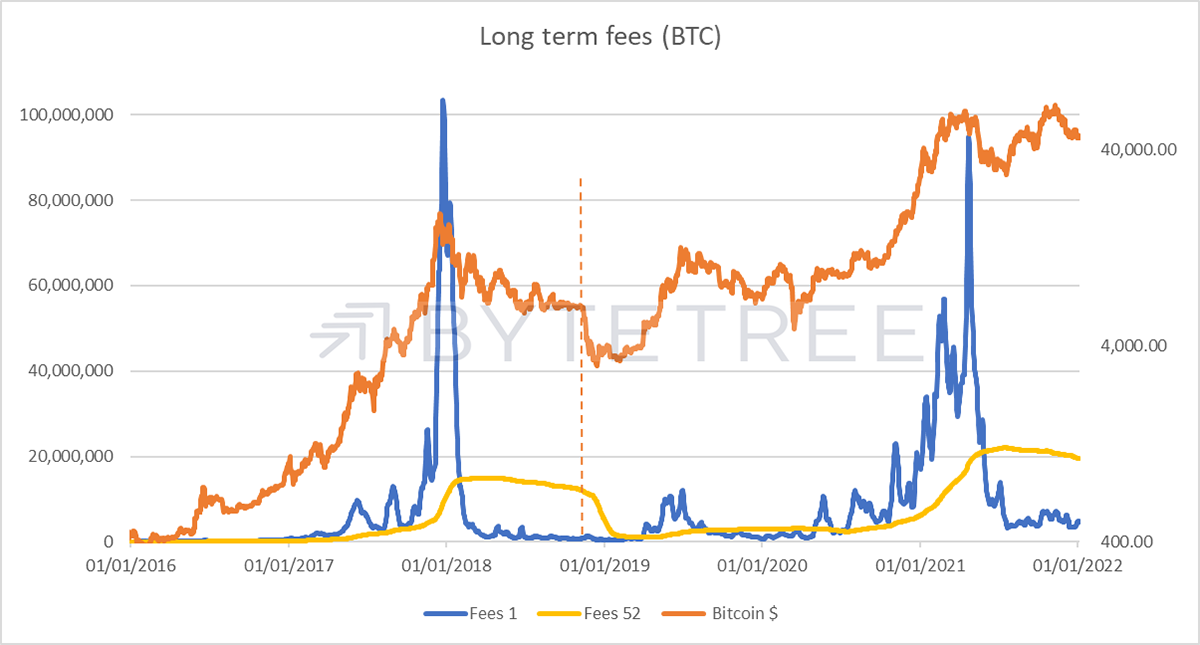
Note how the bitcoin price looked like it was stabilizing in the 11 months after the December 2017 peak. Capitulation only arrived in November 2018 (shown by the vertical dotted line) when the price fell by 40% or so in a fortnight. The shapes of both the 1-week and 52-week fee series are similar now to those seen in the previous cycle.
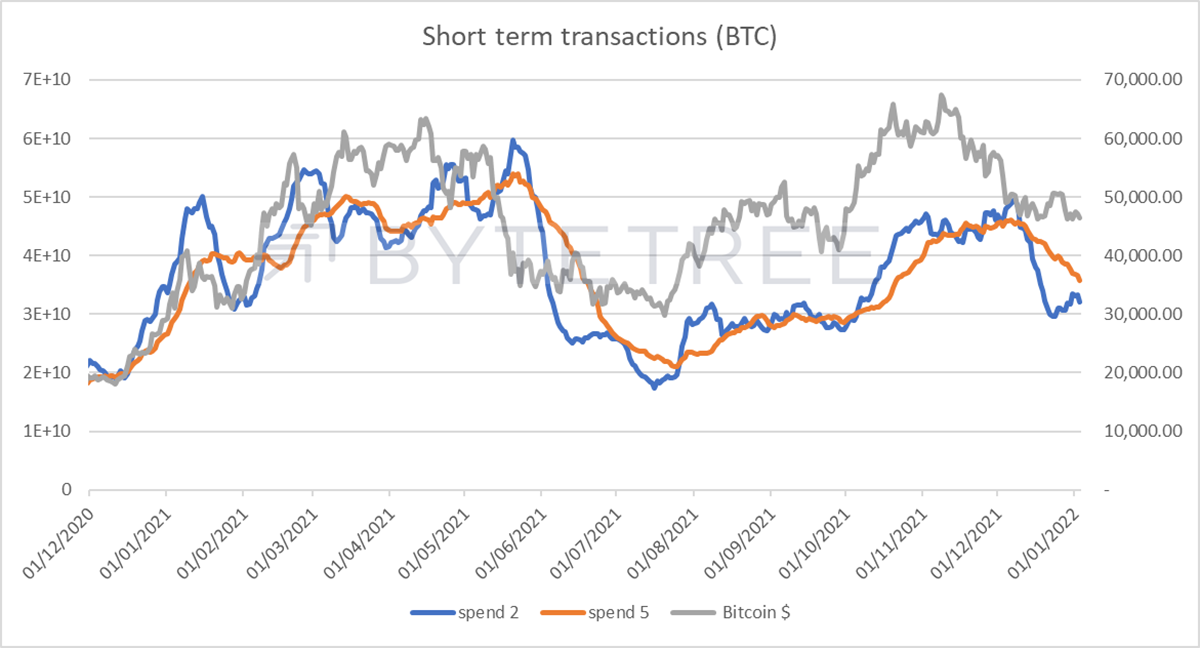
To give greater confidence that there is sustainable upside it would be reassuring to see transaction values increase. At the moment, this is not happening, as shown by the chart below. Indeed, transaction values remain some way below the levels of the first quarter in 2021.
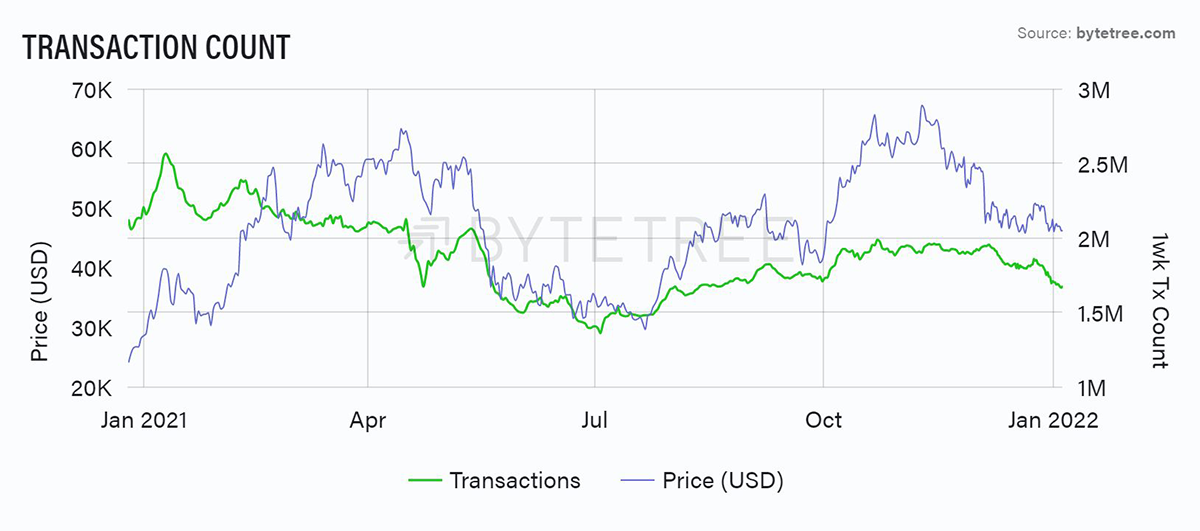
Sustainable price improvements tend to run alongside increases in the number of transactions, as shown in the chart below. The latest peak in transaction count coincided with the October price spike, since when both price and count have been in decline. Until we see a sharp jump, as we did in early July and again in early October last year, it is too early to say we are out of the woods. This market badly needs a catalyst.