

ATOMIC 29
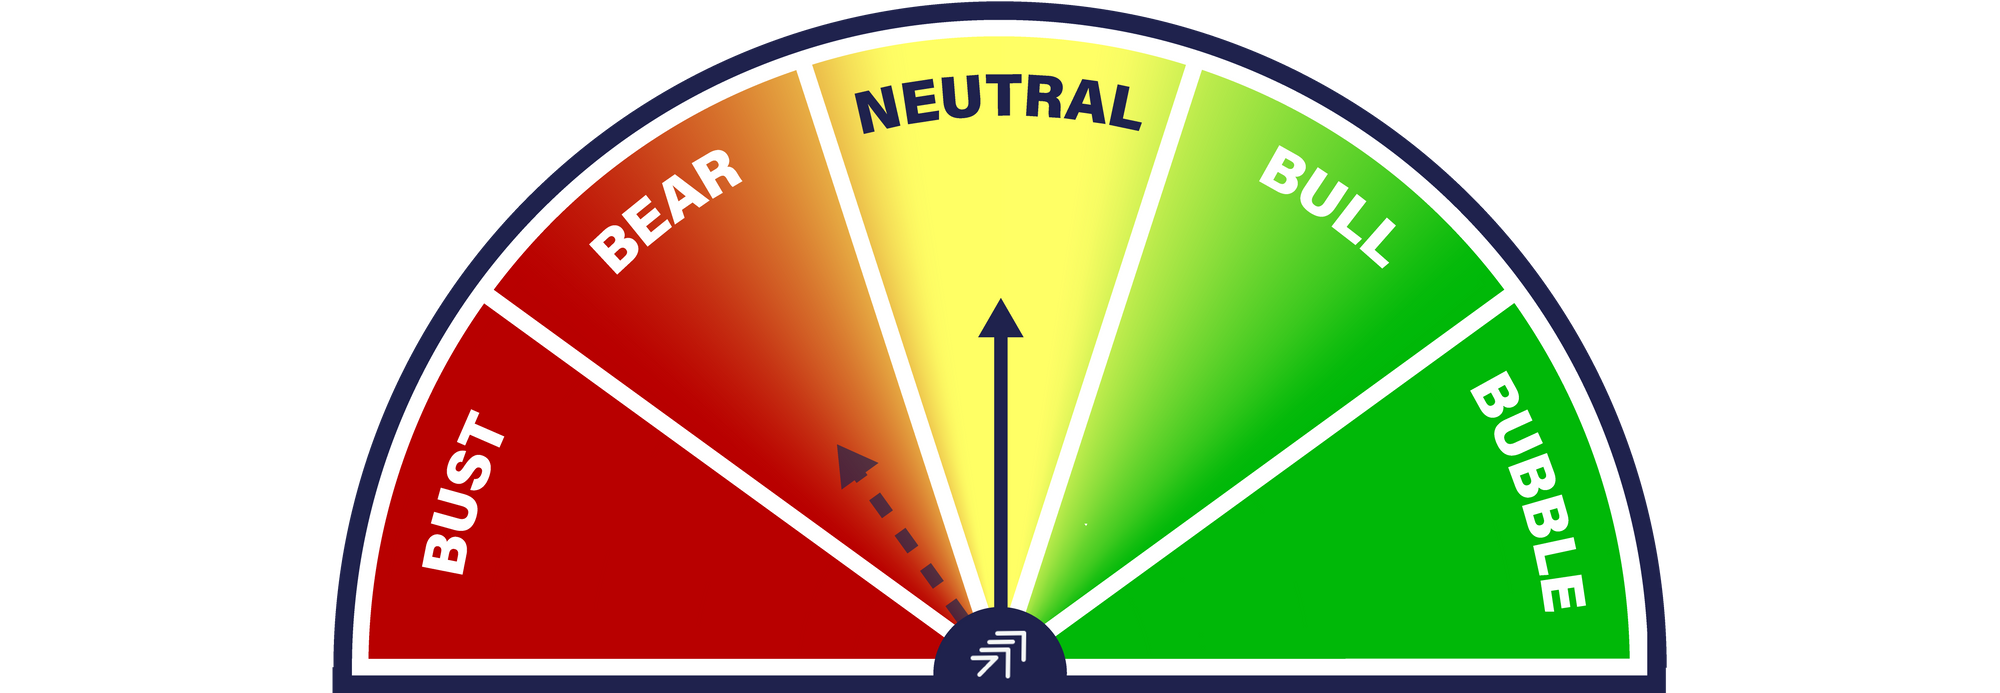
BTC is clearly showing resilience as every time the trend appears to be dead, it bounces. Gold does this and is a sign of asset maturity, which is clearly a good thing.
Highlights
| Technicals | Where’s Santa? |
| On-chain | Fair value dips below $30k |
| Macro | Bonds blow |
| Investment Flows | Outflows |
ByteTree ATOMIC
Analysis of Technical. On-chain, Macro, Investment Flows and Crypto.
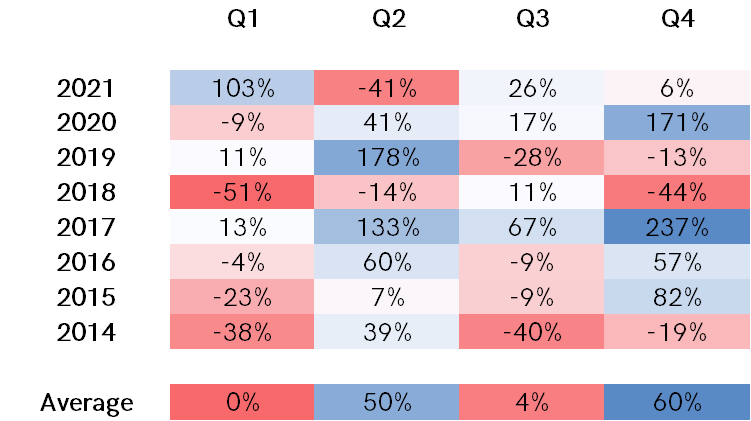
‘Tis the season to be jolly, but before we all get too excited, the first quarter tends to be the weakest period, which some believe relates to US tax selling. The break in 2021 can be attributed to Elon Musk’s first bitcoin tweet. In fact, he didn’t even tweet. He just added “bitcoin” to his handle.
Seasonality
Source: ByteTree.
Before that, the price had been softening, and had it remained soft, then perhaps the rally would have been delayed until Q2, which would have been stronger as a result. But if something is going to break the cycle, it may as well be Musk with his 60 million followers.
Technical
BTC stays at 0/5 while ETH is 2/5.
If you’re unfamiliar with this scoring system, please read the introduction to ByteTrend.
The price is below a negatively sloping 280-day moving average, which was last seen in March 2020, and before that, late 2018. Despite best efforts, it is hard to imagine a sustained jack-in-the-box type move in the short-term.
BTC ByteTrend score 0/5
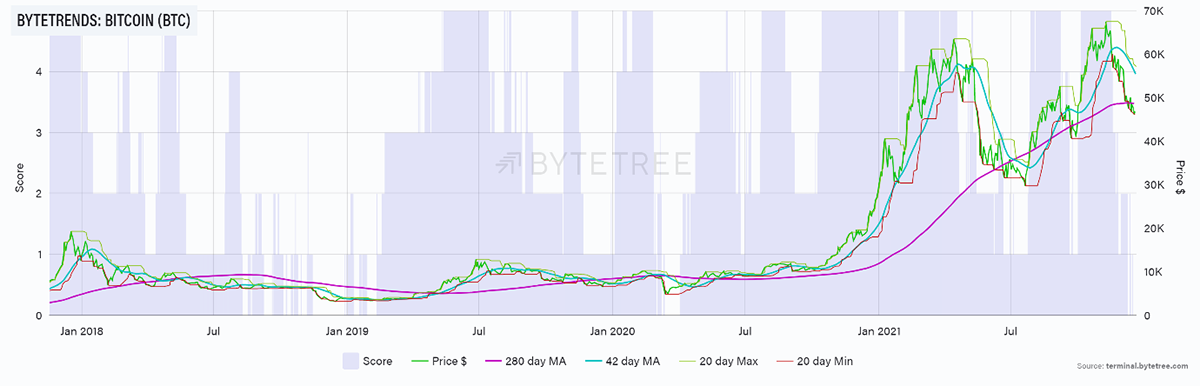
Source: ByteTree. BTC ByteTrend scores since 2016.
A few weeks ago, we said the sentiment would turn if price broke $58k. Today, it seems a close above $50k would be well received. The max line will be there by Christmas.
BTC is clearly showing resilience as every time the trend appears to be dead, it bounces. Gold does this and is a sign of asset maturity, which is clearly a good thing. That is good for price stability, yet on the flip side, it means runaway moves to the upside become less frequent. The price action in 2021 reaffirms that, as none of the new highs led to strong upward moves. This contrasts with 2020, and before that, 2017.
The big difference between BTC and ETH is the longer-term trend. ETH will take longer to turn around, which ought to be more supportive.
ETH ByteTrend score 2/5
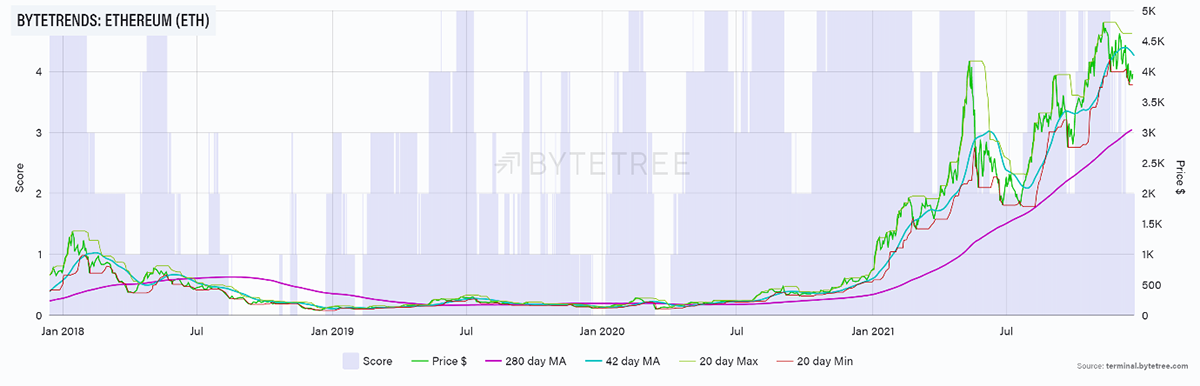
Source: ByteTree. ETH ByteTrend scores since 2018.
That continues to be reflected in the relative trend, which is strong. As stated last week, the problem here is ETH sees higher fund outflows compared to BTC.
ETH (priced in BTC) score 5/5
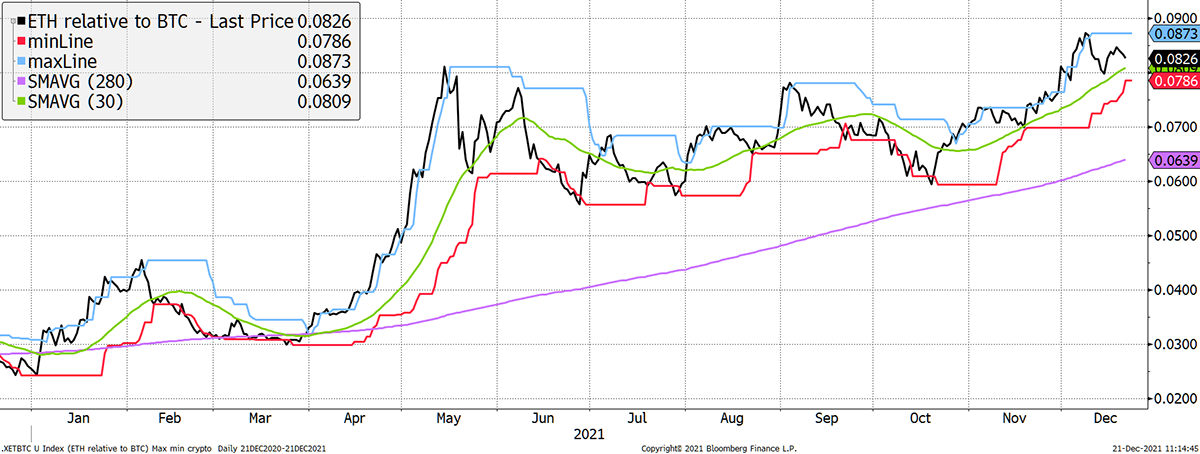
Source: Bloomberg. ETH in BTC with ByteTrend moving averages past year.
Investment flows
BTC and ETH weekly flows have turned negative for the first time since the spring.
BTC
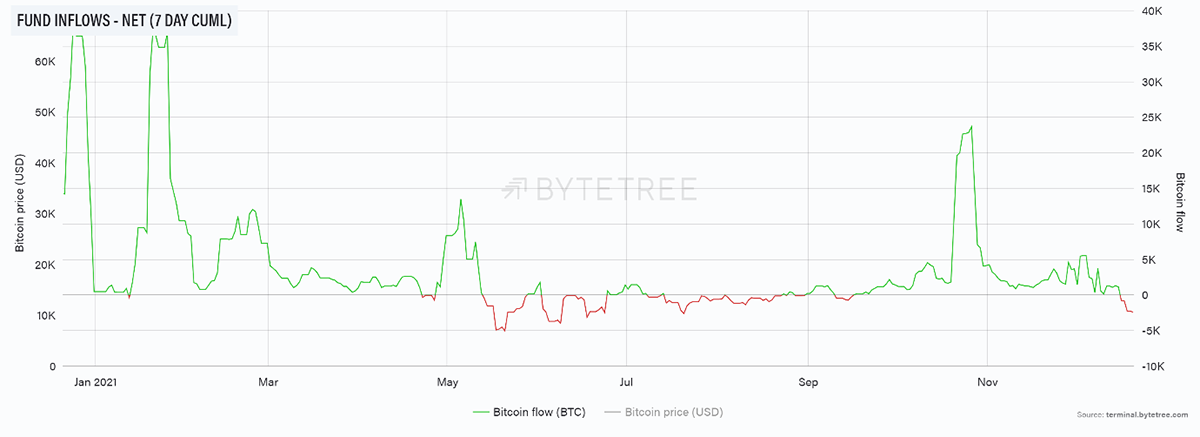
Source: ByteTree. Bitcoin fund inflows (net, 7-day cumulative) over the past year.
ETH has seen its lowest weekly reading on record, which I imagine could prove painful.
ETH
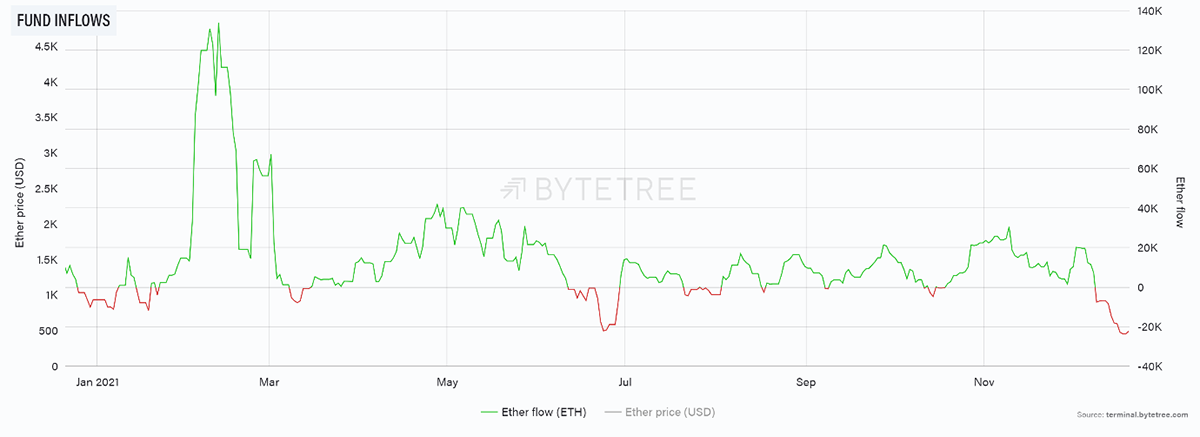
Source: ByteTree. ETH fund inflows over the past year.
Grayscale (GBTC) has also shown its widest discount ever, which is above 20%. Institutional demand is light, as confirmed by ByteTree’s Institutional Dominance Ratio (IDR).
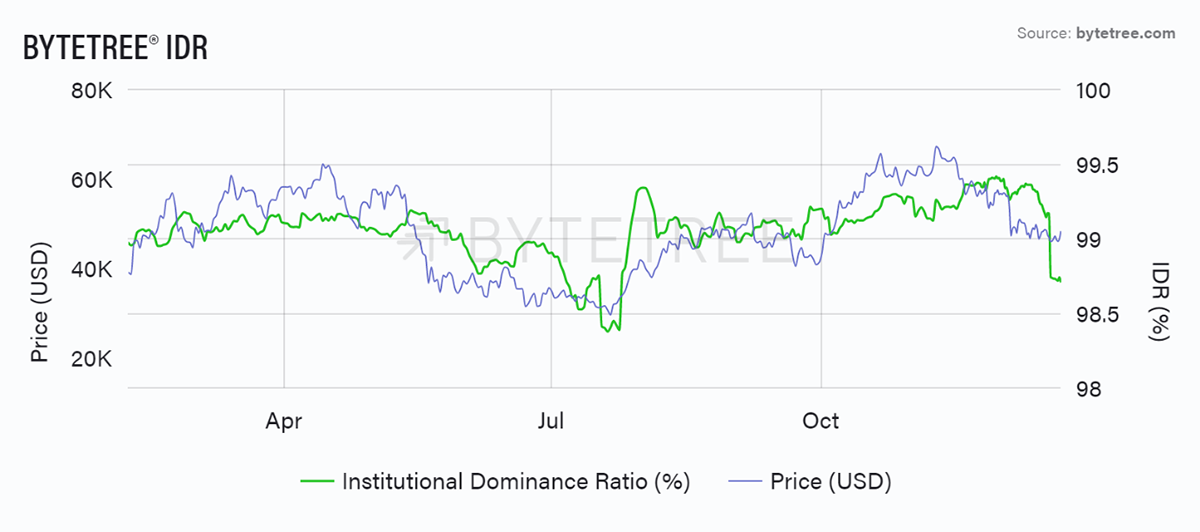
Source: ByteTree. IDR (%) and the bitcoin price in 2021.
Things can change quickly in BTC. IDR gave a compelling buy signal as the large orders came through on the blockchain. That is something to be ready for if it happens again.
On-chain
A weak blockchain is a risk. Nothing new to report since last week, but the value gap remains wide.
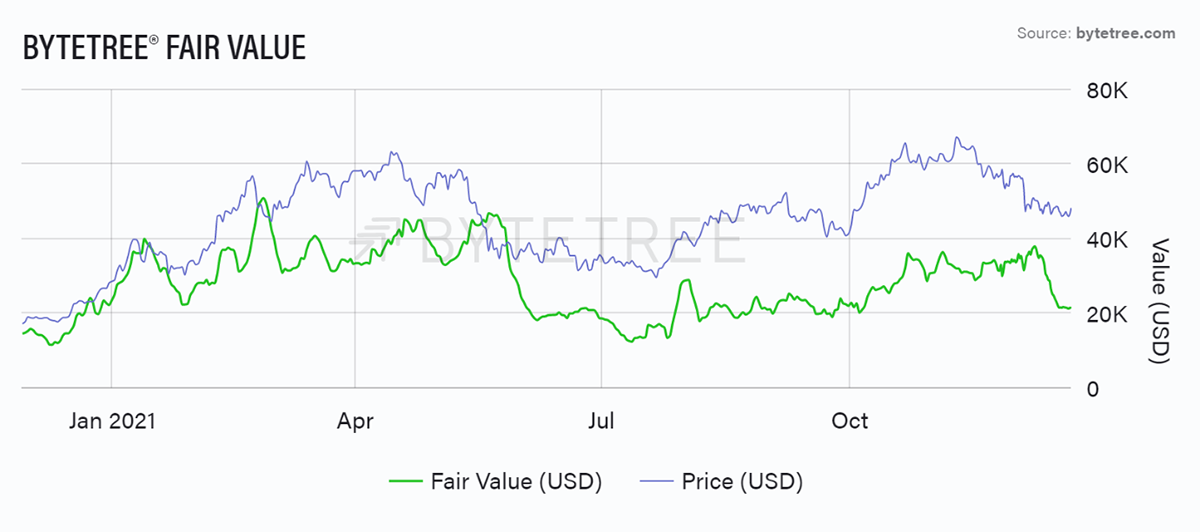
Source: ByteTree. ByteTree Fair Value (USD) and the bitcoin price (USD) in 2021.
Macro
Yet this past week has been dominated by macro events. The Federal Reserve pledged to tighten policy more quickly than expected. Will they? Unlikely, but there’s a big asset bubble out there, and it is hard to imagine this being sustained for much longer.
The other issue is China. The Hang Seng China Enterprises Index is 0/5 on weak breadth.
Chinese equities make new lows
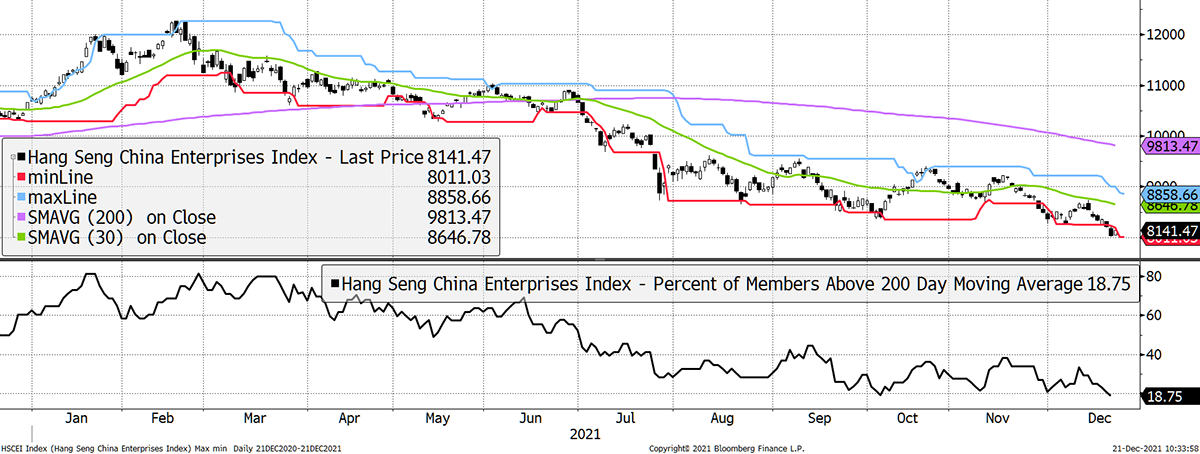
Source: Bloomberg. Hang Seng China Enterprises Index ByteTrend over the past year.
The stock market is weak, much of it down to property companies evaporating - as they do. Yet the malaise is spreading, and the US bond market is finally giving us a sell weak breadth signal too. Like Covid-19, this is no longer contained in China.
This chart records the cumulative advance decline line for the US bond market by recording risers and fallers. The previous negative periods were 2007/8, 2015 and 2018. All of these caused the stockmarket to rumble.
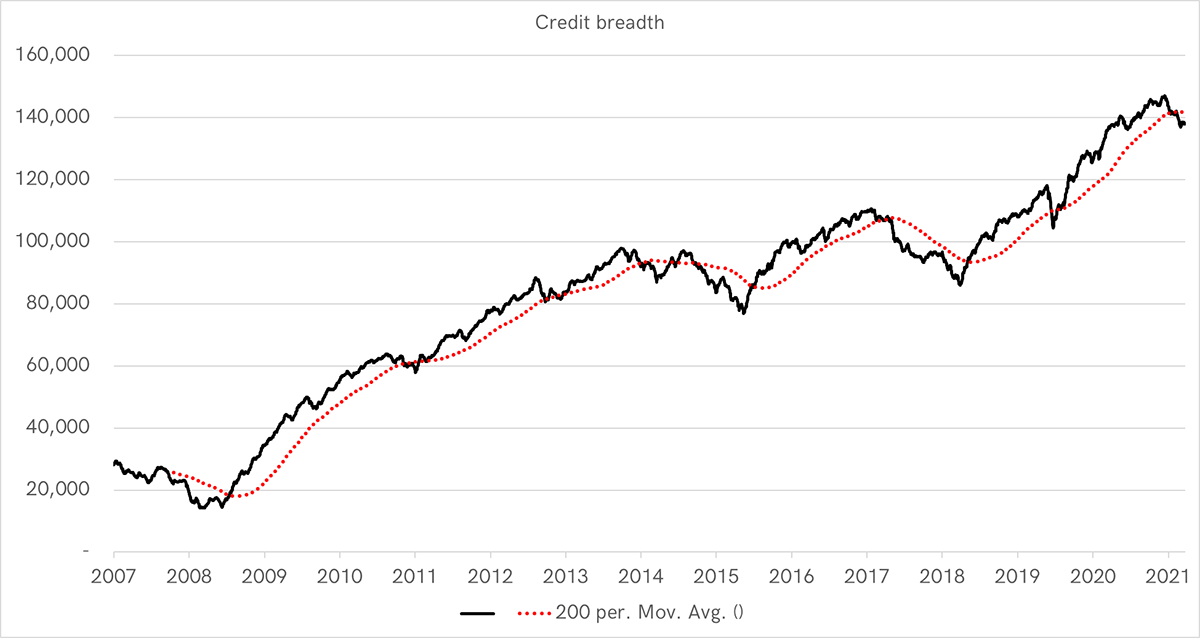
Source: FINRA. US bond advance decline line since 2007.
What does this mean for crypto?
Clearly, the market element is bearish as investors dive for cover. But as always, it’s best to focus on the fundamentals.
Inflation expectations are likely to be important, certainly for BTC with its monetary credentials, over and above the alts. So far, the short-term inflation expectations are indeed falling, but at least short-term expectations remain above the long term. This could yet prove to be a strong inflationary environment.
Inflation cools but trend is still upward
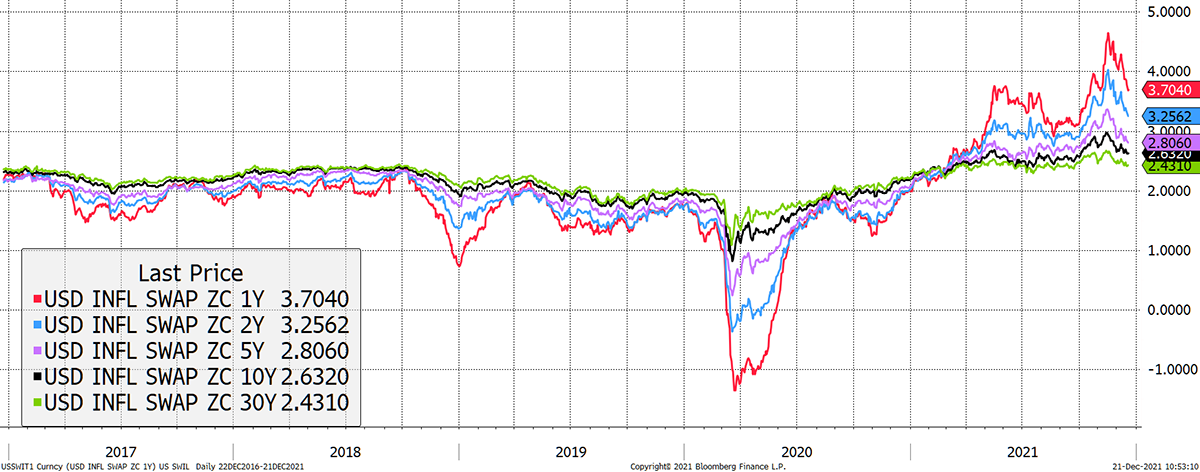
Source: Bloomberg. US inflation swaps (expectations) 1, 2, 5,10, 30-year since 2017.
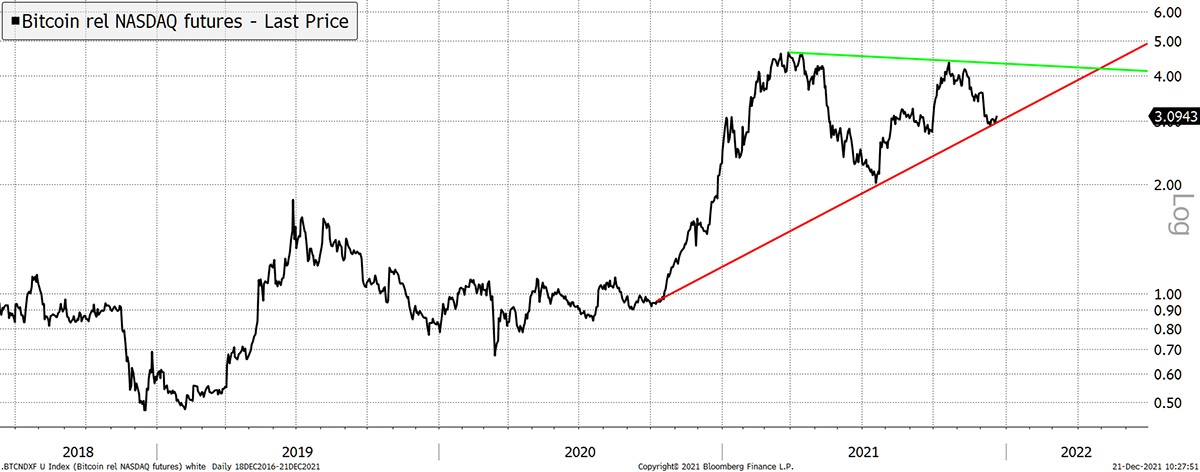
The answer lies in this chart. BTC is still in a range with the NASDAQ. A new high above 5 would settle this and tell the tech sector to sell up and shift to crypto. The good news is that we’ll probably know the answer by the end of Q1. That’s just in time for the next bull season.
Bitcoin vs NASDAQ
Source: Bloomberg. US inflation swaps 1-year to 30-year over the past two years.
This really is the single most important relationship. The NASDAQ, and tech in general, represents trillions of dollars. If crypto can attract that marginal wealth, the best times will lie ahead.
Summary
ATOMIC will return in the new year. We wish you and your family a very Happy Christmas.

