

ATOMIC 28
ByteTrends will be available very soon and will be extremely useful in spotting early trends. Solana, which peaked at $250, was first picked up at 92 cents in summer 2020. Best to keep our eyes peeled.

Highlights
| Technicals | Introducing ByteTrend |
| On-chain | Fair value dips below $30k |
| Macro | Turn off the lights |
| Investment Flows | Switching from ETH to BTC |
| Crypto | Ether College - part 5 |
ByteTree ATOMIC
Analysis of Technical. On-chain, Macro, Investment Flows and Crypto.
Introducing ByteTrend, which will soon be live on the site. This allows chart screening which is particularly useful when processing a large number of charts.
A ByteTrend score gets a point for each of the following criteria:
- Price is above the 200-day moving average
- Price is above the 30-day moving average
- 200-day moving average slope is rising
- 30-day moving average slope is rising
- The last touch of the max/min lines was blue
As I write, there are not many string charts as the market is cooling. Yet the Leo Token (LEO) scores 5/5. I highlight a good chart. Best to make a habit of buying good charts and selling bad ones.
LEO Token scores 5
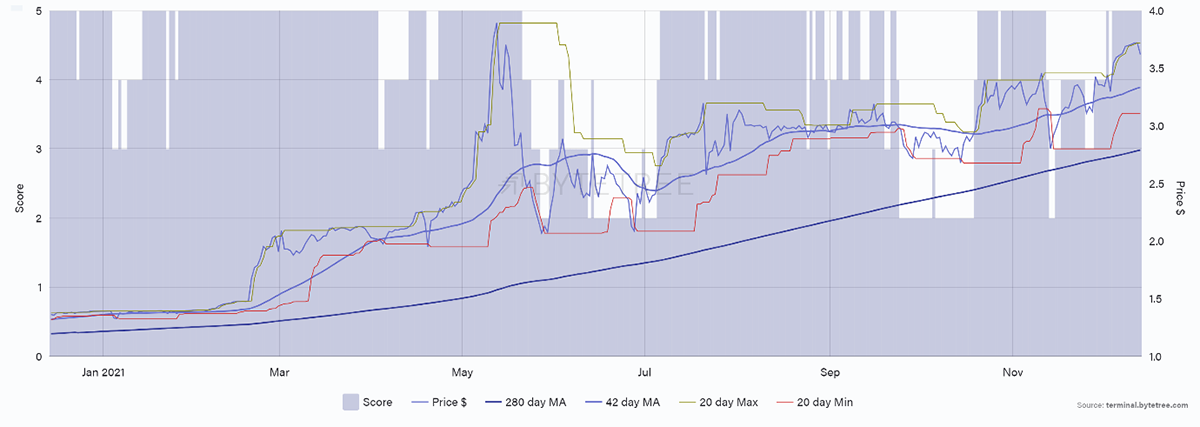
Source: ByteTree. ByteTrend for LEO over the past year.
Speaking of bad charts, DOT turned to a zero on 4 December, having enjoyed a strong run since the summer. The score is zero as the long-term moving average has turned down alongside short-term price weakness. The blue area highlighted is the historic score.
DOT
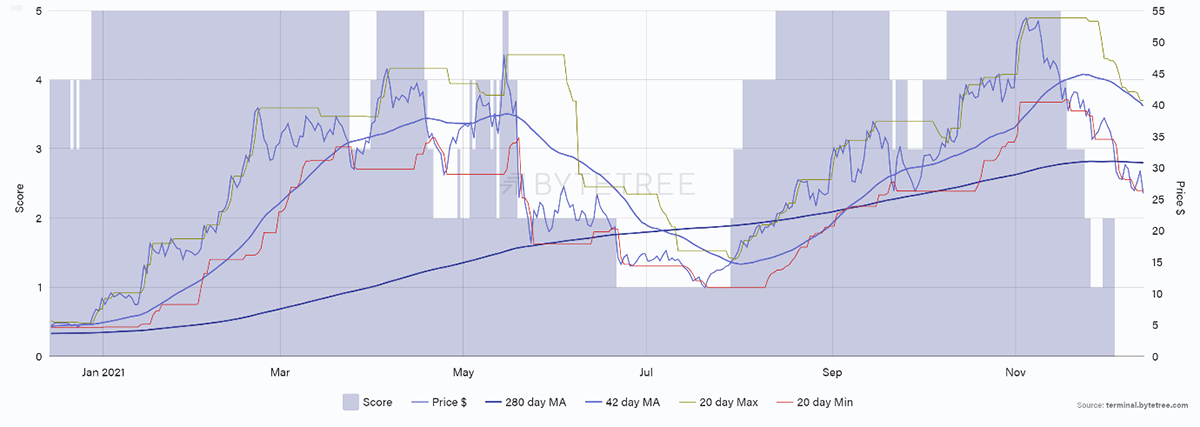
Source: ByteTree. ByteTrend for DOT over the past year.
If you find the lines too noisy, you’ll be able to turn them off.
DOT
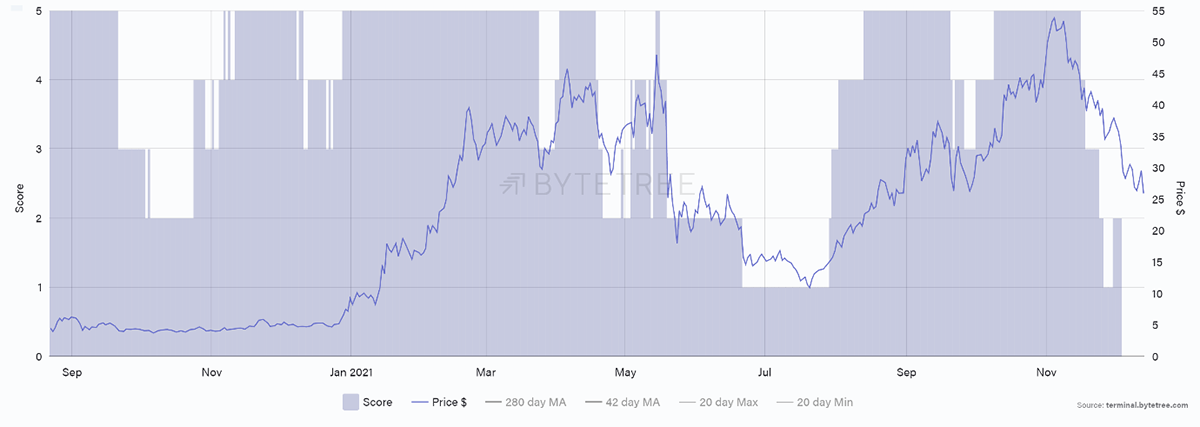
Source: ByteTree. ByteTrend for DOT over the past year.
This will be available very soon and will be extremely useful in spotting early trends. Solana, which peaked at $250, was first picked up at 92 cents in summer 2020. Best to keep our eyes peeled.
There will be a number of indicators that come with this dataset which will make a huge difference to our ability to interpret the crypto space. We are very excited about this development.
Technical
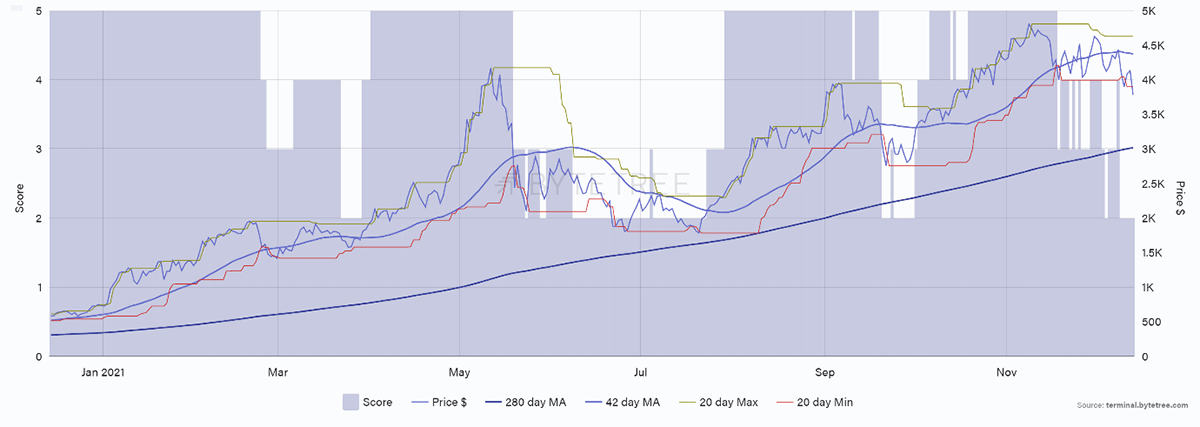
Sadly, BTC scores a zero as the 280-day moving average has turned negative. We have decided to shift from 200- and 30-day moving averages to 280- and 42-day to compensate for weekends.
After consideration, it was decided that a BTC ETF that doesn’t trade at weekends should not have a different score from the underlying ones which do trade at weekends. Hence, old-world assets will use 30- and 200-day moving averages, while crypto will be shown with 42- and 280-day moving averages. This makes sense.
Using a 200-day moving average, as we had been doing, BTC did briefly see a score of zero over the summer. That wasn’t the case using 280-days, but it is now. The BTC trend is bearish.
BTC ByteTrend score 0/5
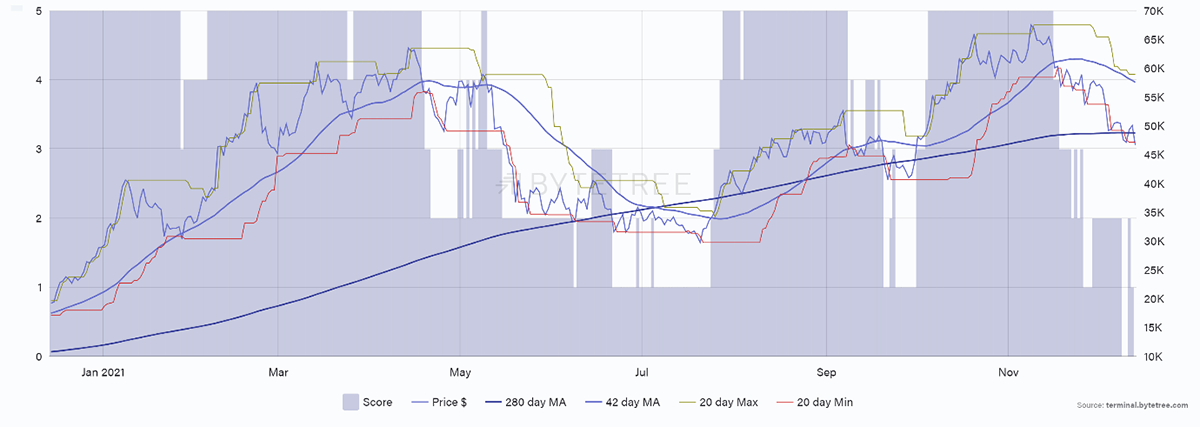
Source: ByteTree. ByteTrend for BTC over the past year.
We would also highlight the break of the two-year trendline since March 2020 that ascends at 283% per annum. That’s a 3x per year line, which is hard to sustain for long.
BTC 3x per annum is unrealistic
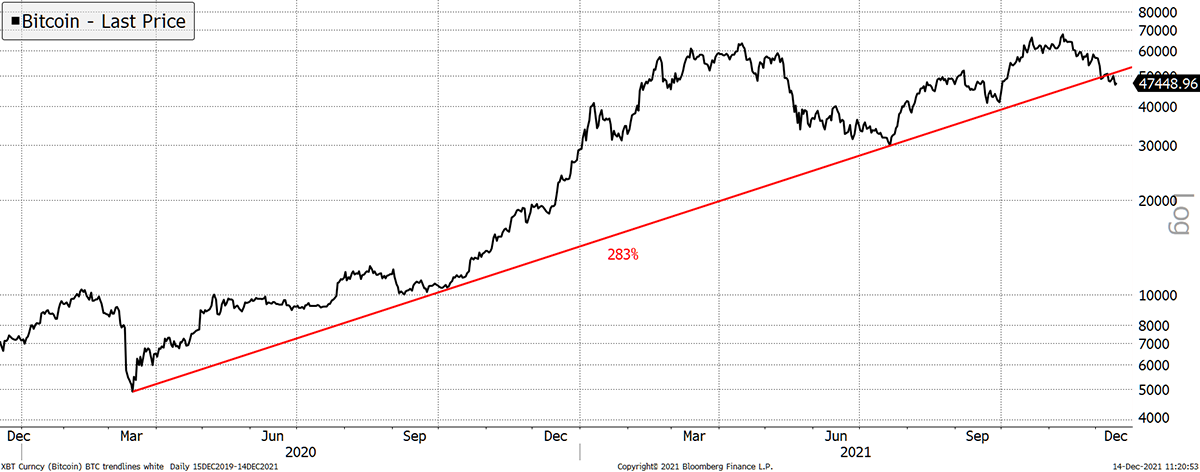
Source: Bloomberg. Bitcoin price over the past two years.
ETH is down from 3/5 to 2/5 as the short-term moving average is falling.
ETH ByteTrend score 2/5
Source: ByteTree. ByteTrend for ETH over the past year.
ETH is still trending higher vs BTC but has failed to make new highs. Moreover, ETF holders have turned sellers and are taking profits.
ETH (priced in BTC) score 5/5
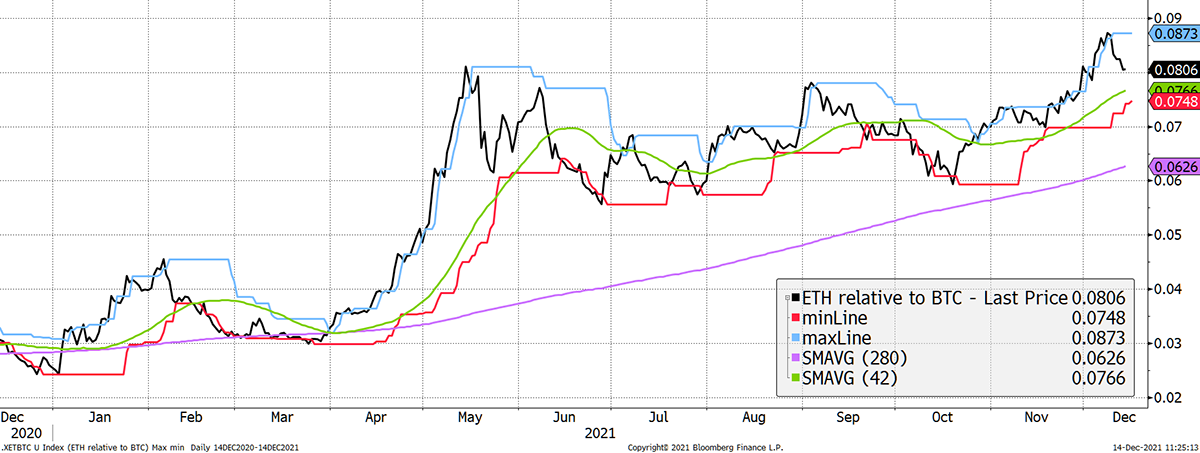
Source: Bloomberg. ETH in BTC with ByteTrend moving averages over the past year.
On-chain
The network is sliding again. Fair Value is derived from on-chain activity, and it is dropping off quickly. Fair Value is back below $30k, and that is uncomfortable.
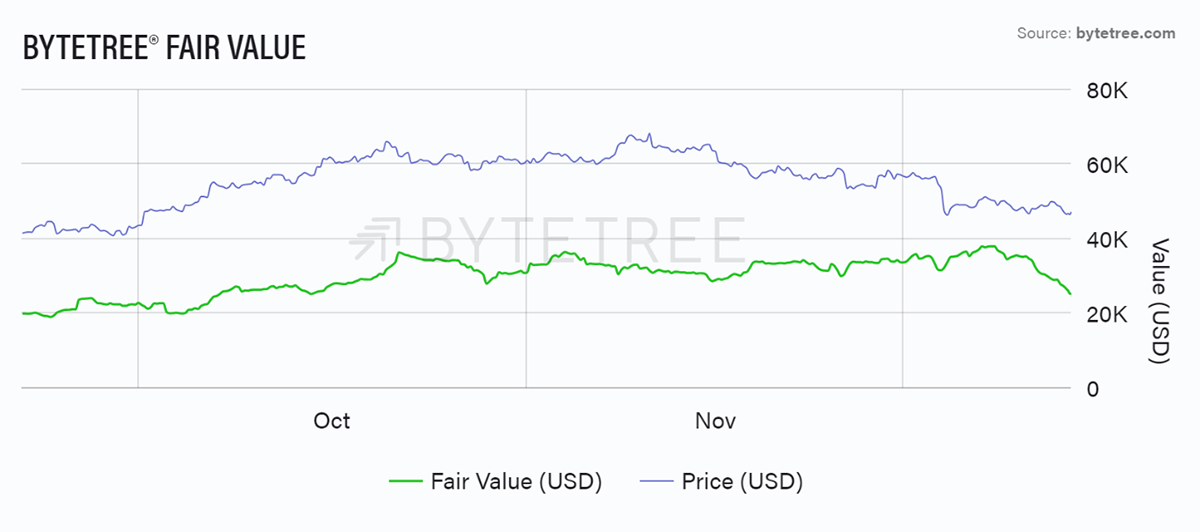
Source: ByteTree. ByteTree Fair Value (USD) and the price of bitcoin (USD) over the past 12 weeks.
We also see weakness in the number of transactions.
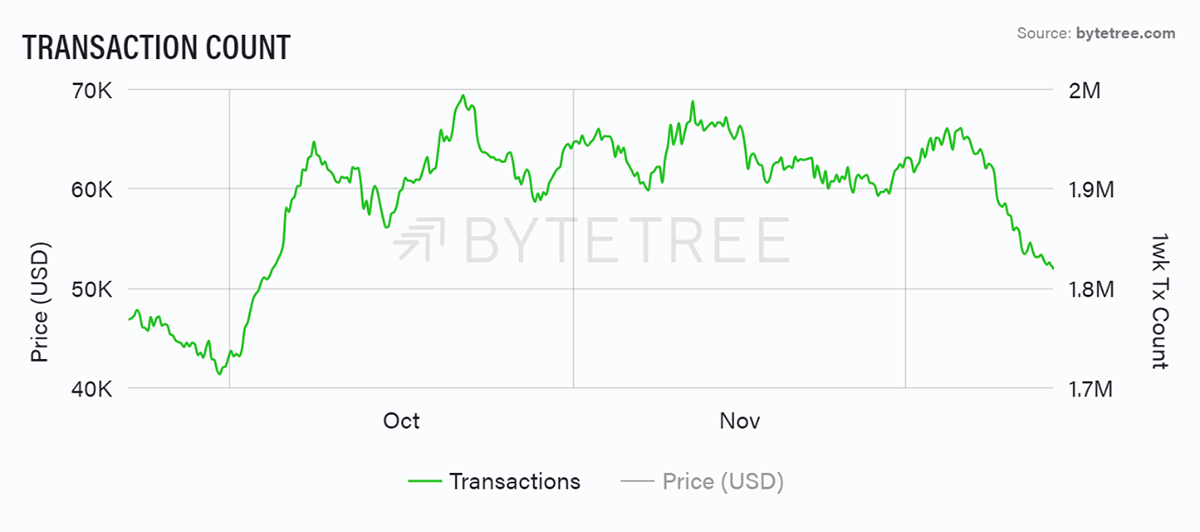
Source: ByteTree. Bitcoin transaction count over the past 12 weeks.
It is rare to see huge price advances with weak on-chain data, but 2021 has been full of surprises. In contrast, 2020 was so simple as the price simply followed network activity.
Investment flows
Contrasting the fund flows of BTC and ETH, it appears ETH outperformance may have tired. Investors have been taking profits in ETH and presumably taking sanctuary in BTC.
BTC
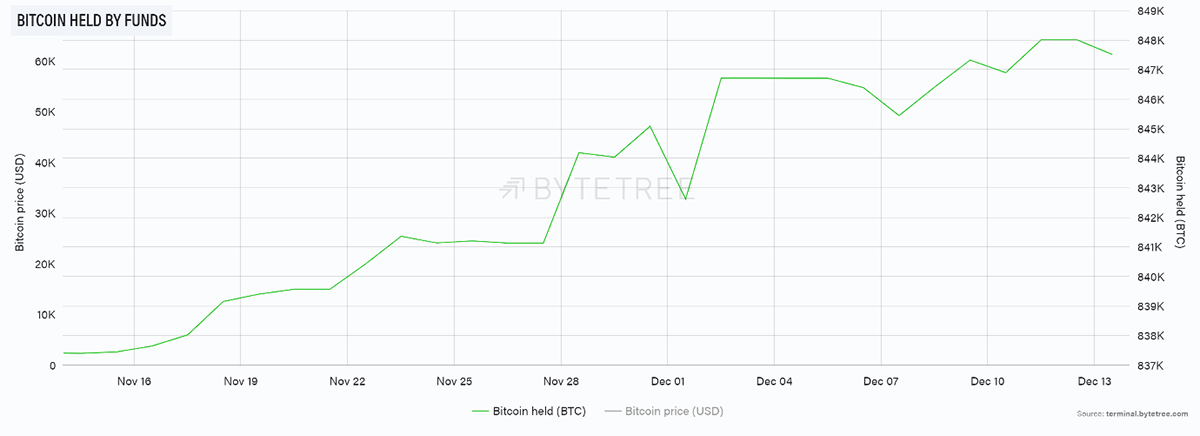
Source: ByteTree. Bitcoin held by funds over the past month.
ETH
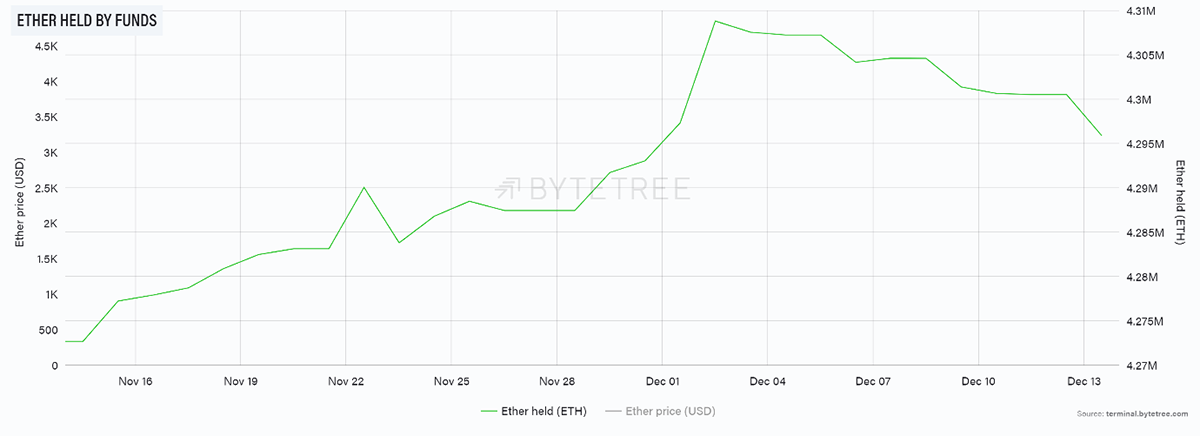
Source: ByteTree Terminal. Ether held by funds over the past month.
Yet, it is also worth highlighting the Grayscale discount (GBTC) has slipped again. This has moved to a near-record low, meaning it is easier to buy BTC than sell.
GBTC discount remains wide
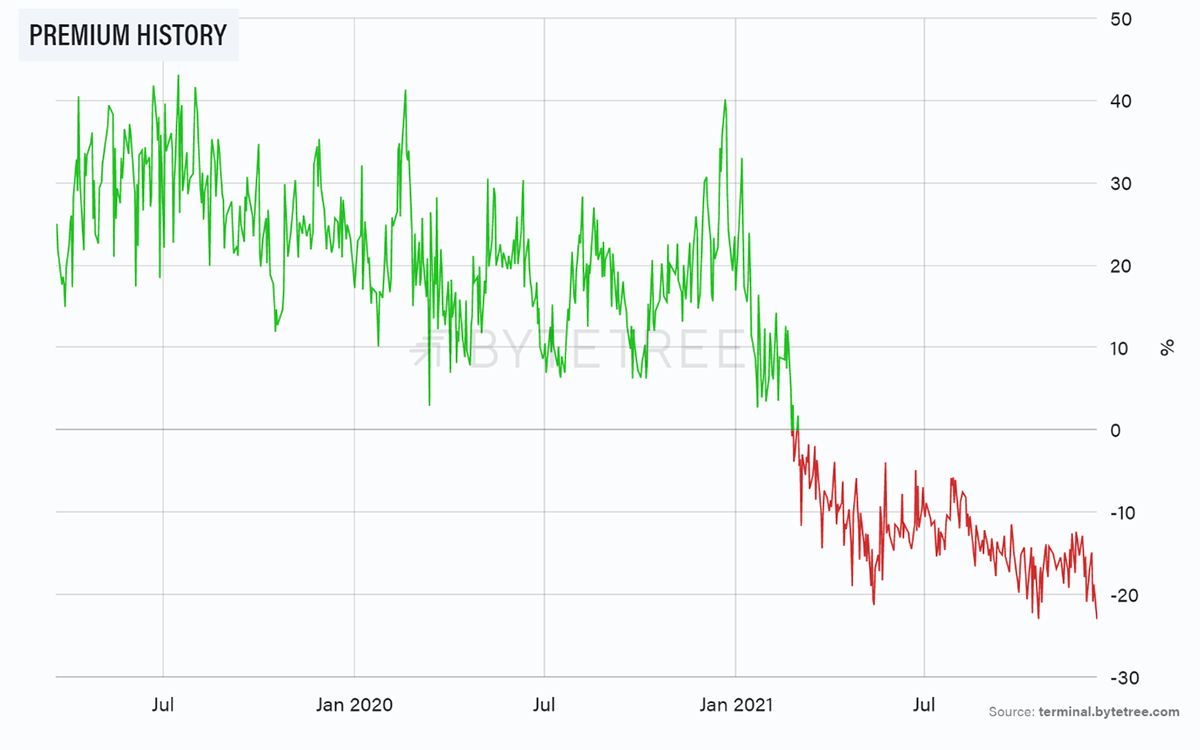
Source: ByteTree. GBTC Premium history.
The bottom line is the crypto bid has weakened again. It is one of those moments when you need the likes of Musk and Saylor to come up with a new story.
Macro
We have highlighted the strength of the US dollar and falling rates alongside deterioration in speculative equities. The bigger picture sees the investment tide going out, and crypto cannot swim against it.
For example, Tesla is back below $1,000, and the leading tech stocks are coming under pressure. The latest virus news isn’t helping either.
The one chart that is important right now is the inflation outlook. Some of the elements are proving to be transitory as the economy cools, while others are more resilient. It Is not yet clear whether the outlook is cooling slightly or is blatantly turning back down.
US inflation is not collapsing
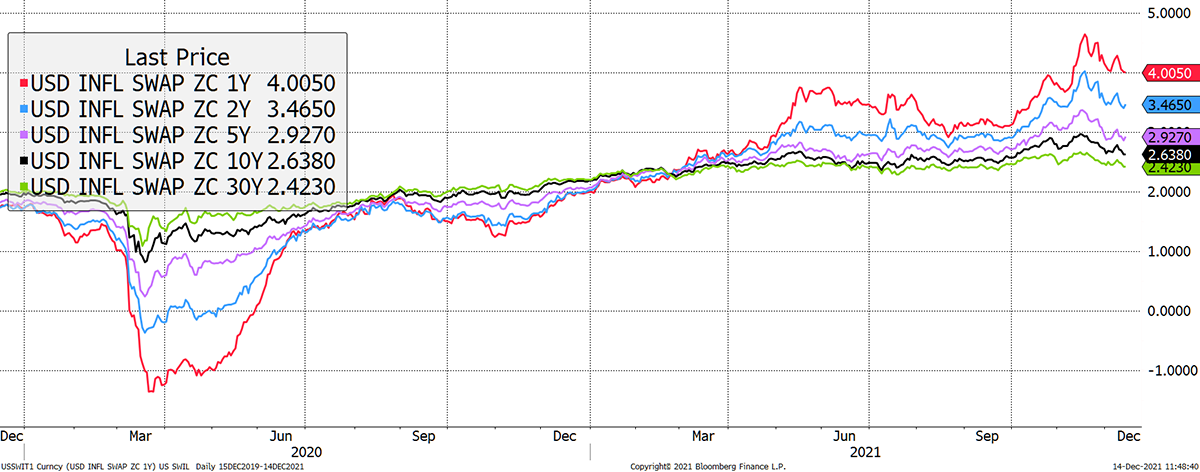
Source: Bloomberg. US inflation swaps 1-year to 30-year over the past two years.
Yet, whichever it is, we are a long way from a collapse like we saw in 2020.
One issue is that the increase in CPI since March 2020 is 8.5%. That means the dollar buys you less stuff as it is only worth 91.5 cents compared to back then. Yet BTC is up 10x, and so the inflation narrative is overplayed by multiples.
The point is that BTC can fall and still be considered to be an effective longer-term inflation hedge. We’ll need one as no one dares turn on the lights in Europe anymore. The price of electricity looks like Solana did in the summer.
Turn off the lights
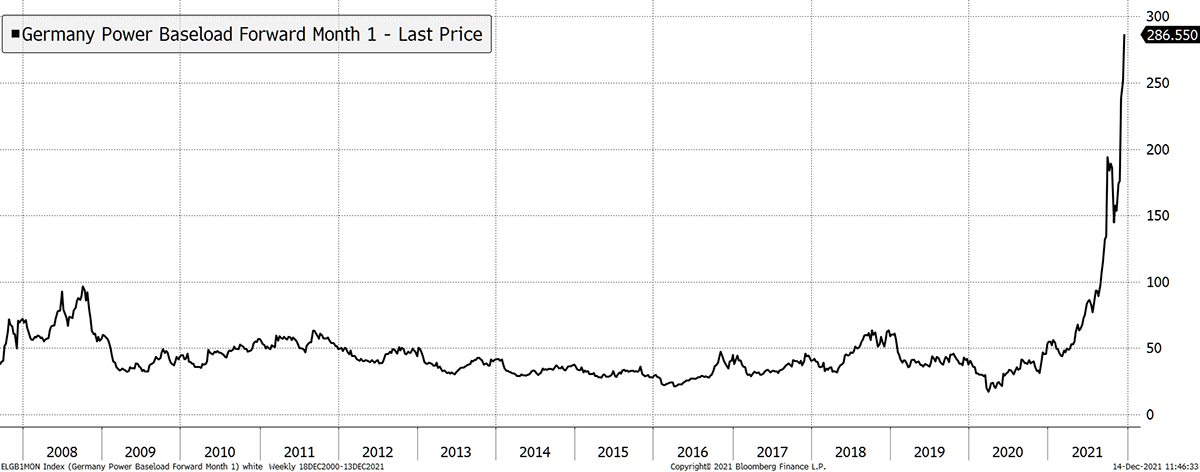
Source: Bloomberg. As described since 2008.
ETH College
- by Tom Salter
Ethereum’s mission is to become the world computer. Still, as we’ve seen, this vision seems more like a fantasy when looking at the inefficiencies of Ethereum’s Proof-of-Work (PoW) consensus method. Ethereum has been looking for alternatives, of which the obvious replacement is Proof-of-Stake (PoS) - but how do we get there?
Layer-2s build on top of Ethereum, typically with a PoS system settling onto the more secure but cumbersome Ethereum PoW. ETH 2.0 is different, as it aims to create an entirely separate Ethereum under the PoS banner. The latter is structural, while the former is a localised solution.
A Long Wait Ahead
There are three main phases of switching Ethereum to PoS. While Ethereum has released staking on the Beacon Chain (Phase 0), we still have a long time to wait. Even Vitalik Buterin, Co-Founder of Ethereum, approximated between 2025-2030 for the full release of ETH 2.0, which is certainly bullish for ETH-Killers.
The waiting time between migration from the unscalable blockchain to ETH 2.0 is paramount for Ethereum’s continued market dominance. Who is going to prop up the largest smart contract blockchain in the meantime? Layer-2 solutions is the only option.
For a more detailed evaluation of ETH, read my previous articleon the subject. See you again next week.
Summary
The dial remains at neutral because it is easy to see the market softness continuing. It is a shame to see the Fair Value back into the $20k zone. In 2021, this concept hasn’t worked as the masters were always able to reignite the narrative. When they are no longer able, the price will return to Fair Value.

