

ATOMIC 27
The best bit about lower prices is the improved value on offer. Higher prices can be risky because they have the potential to fall. Once they fall, the asset becomes less risky because there is less downside. That assumes the asset is credible over the long-term and doesn’t go to zero.

Highlights
| Technicals | ETH beats BTC in a major correction |
| On-chain | Best value since the spring |
| Investment Flows | Steady, but closed-end discounts remain wide |
| Macro | Tech wreck |
ByteTree ATOMIC
Analysis of Technical. On-chain, Macro, Investment Flows and Crypto.
Friday and Saturday were brutal. Crypto was not alone as the stockmarket also took a beating. The number of successful assets that are riding high around the world is falling. Early 2021 was too good to last, and it is payback time.
During these minor earthquakes, the good stuff holds up. Isn’t it remarkable that ETH beat BTC during the correction?
The best bit about falling prices is that previously hyped assets fall into value territory. BTC is now trading at fair value. That is in part due to a lower price, but also to a more vibrant network. Celebration.
Technical
A month ago, we were talking about BTC at $67k. What a difference a month can make. These falls give institutional investors all the ammo they need to steer clear of this space, and you can’t blame them for that.
I stated two weeks ago that a move below $58k would see sentiment change. That worked. BTC just touched the 200-day moving average, which is touch and go. Below $46k, and we have to seriously question this bull market.
BTC ByteTrend score 2/5
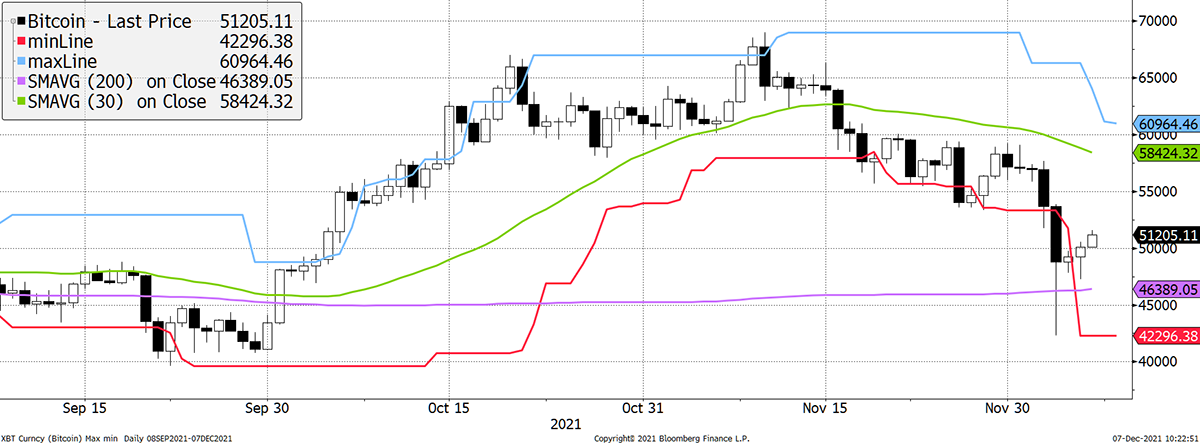
Source: Bloomberg. Bitcoin with 20-day max and min lines, 30-day and 200-day moving averages past three months.
ETH now scores 3/5 as the last touch of the max/min lines was red (bearish). Price has bounced back to the 30-day moving average, which has a negative slope. Still, the chart is so much better than BTC.
ETH ByteTrend score 3/5
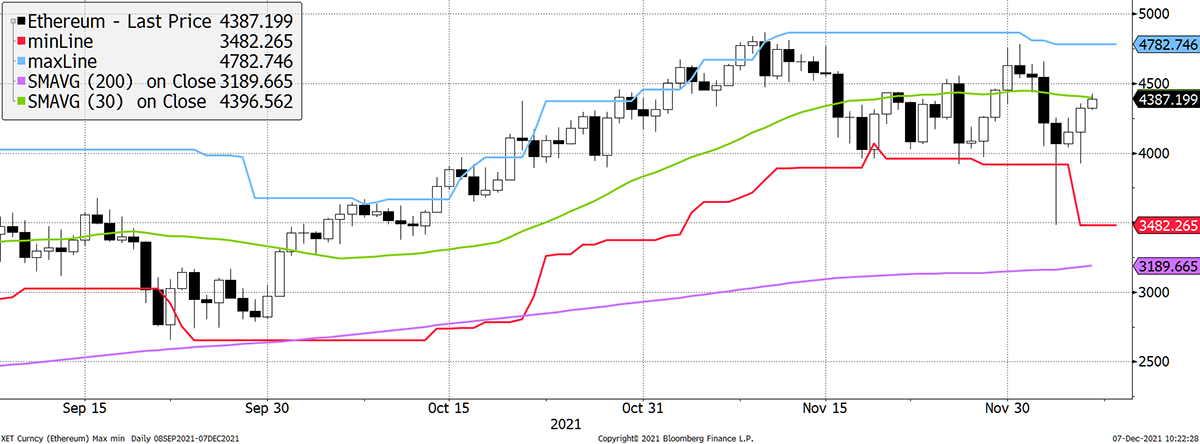
Source: Bloomberg. Ethereum with 20-day max and min lines, 30-day and 200-day moving averages past three months.
The ETH outperformance during a correction is a first. Reading the charts, you would have to go with this. If it sustains, then the market is telling you the application side of crypto will start to shine. We have no problem with that as application is a much easier sell to institutional investors.
ETH (priced in BTC) score 5/5
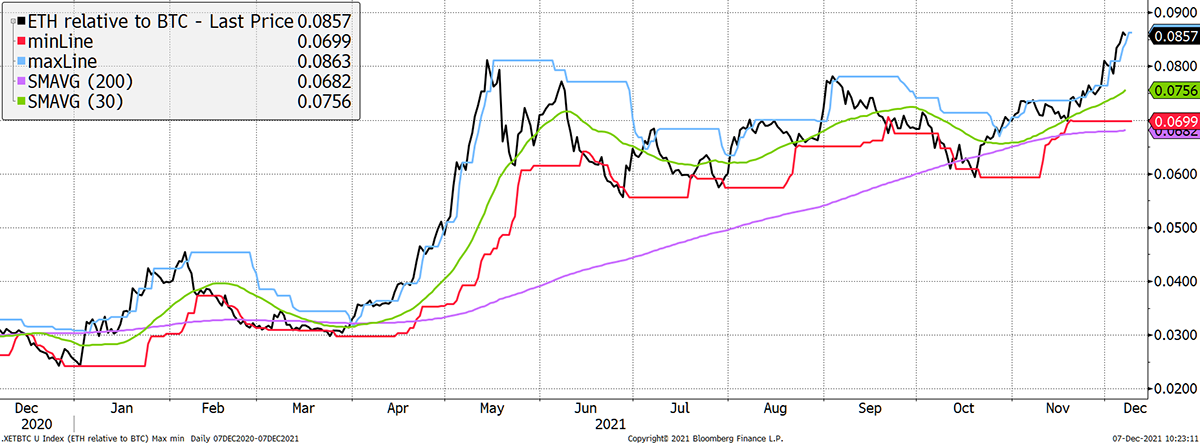
Source: Bloomberg. ETH in BTC with 20-day max and min lines, 30-day and 200-day moving averages past six months.
On-chain
The best bit about lower prices is the improved value on offer. High prices can be risky because they have the potential to fall. Once they fall, the asset becomes less risky because there is less downside. That assumes the asset is credible over the long-term and doesn’t go to zero.
I have always said that the value of bitcoin comes from its network. The simplest measure is the transaction value, which has to remove change from on-chain transactions. ByteTree has the best data in the world in this area. I have taken the total transaction value and deducted the complex and batched transactions, which are unlikely to be economic.
This chart has the left and right axes 10:1 apart and expressed in millions of dollars. That means a $1tr of market cap on the left matches $100 billion of weekly transaction value on the right.
Bitcoin and its network
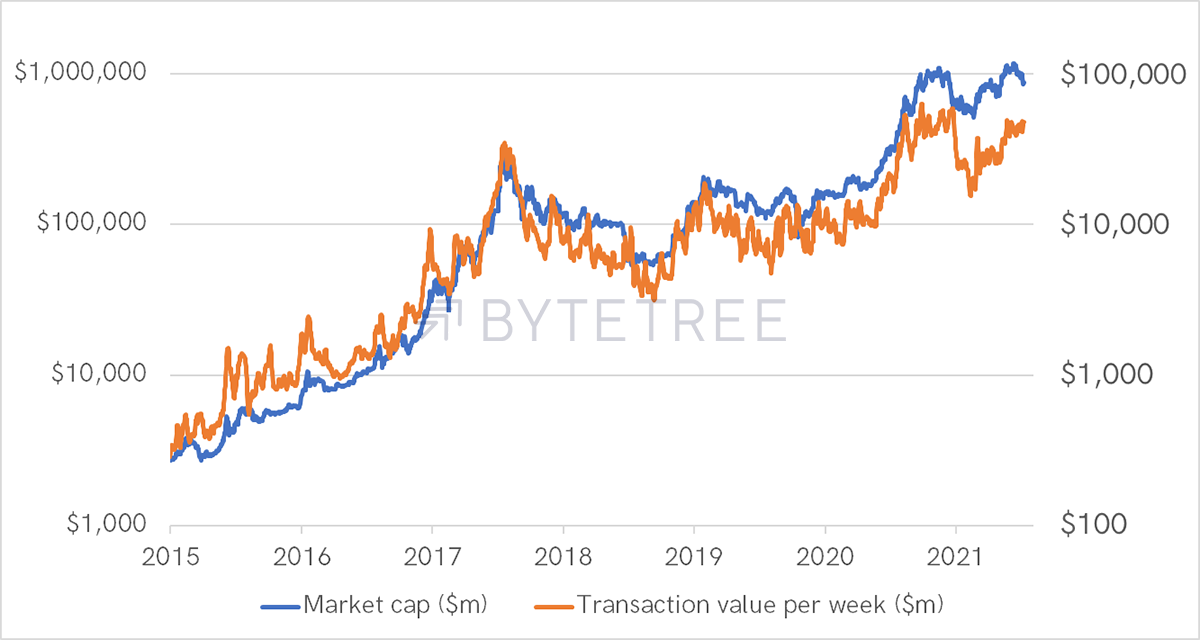
Source: ByteTree. Bitcoin Market Cap $m (blue) and transaction value per week ($m).
Notice how the transaction value used to be higher than the market cap and is now lower. This is shown in the next chart by the NVT. This tells you the number of weeks of transaction value to match the market cap. It used to range between 5 (cheap) and 20 (expensive) weeks until the last six months.
There are various ways to interpret this. One is to assume that the 5 to 20-week range is valid and recent readings of 35 weeks have been excessive. At least they have cooled to 17 weeks.
The other is to recognise that bitcoin hasn’t been around long enough to define a range. Post-2018, the range has been 10 to 22-weeks; that is until recently. If we add a two-year smoothing, that can be used as a reference point. Move below that smoothing and bitcoin is cheap, above expensive. Right now, bitcoin has returned to the average for the first time in a while.
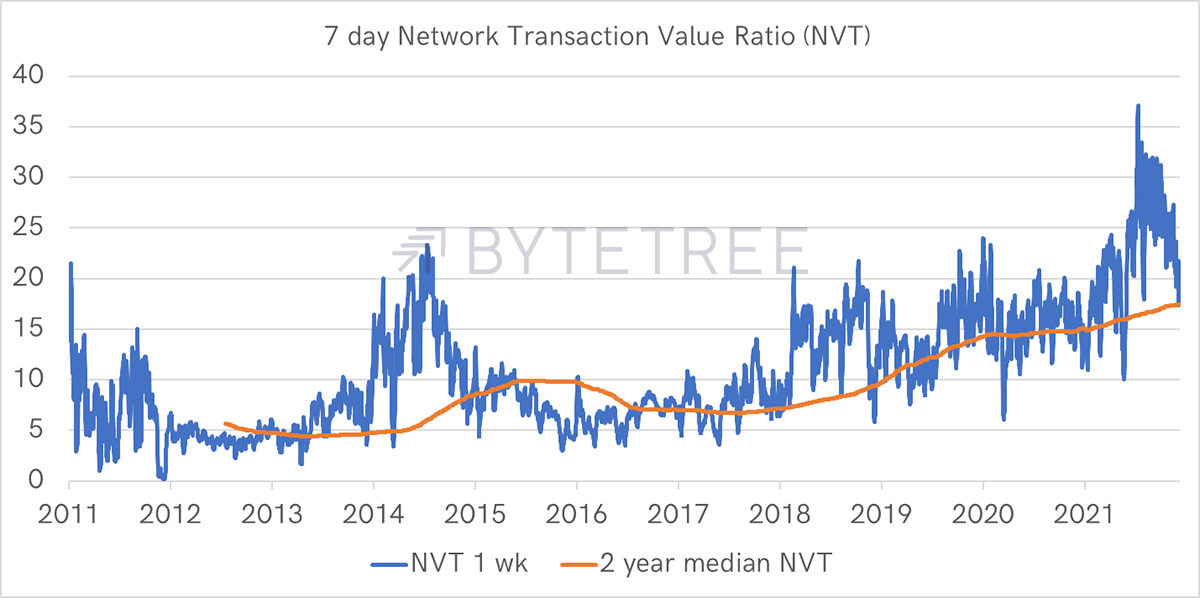
Source: ByteTree. 1-week NVT (blue) and the two-year median NVT.
This data can also be expressed as a measure of fair value.
Bitcoin and fair value
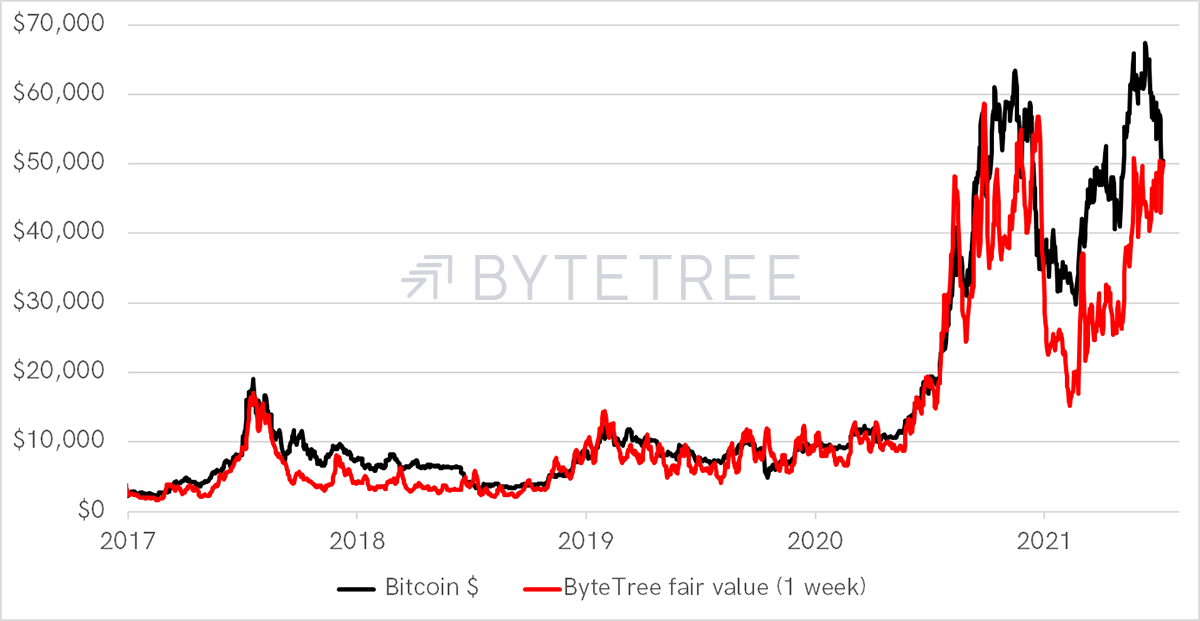
Source: ByteTree. Price of bitcoin ($) and ByteTree 1-week Fair Value, since 2017.
And be displayed as a discount or premium. It is always comforting to be back to the line.
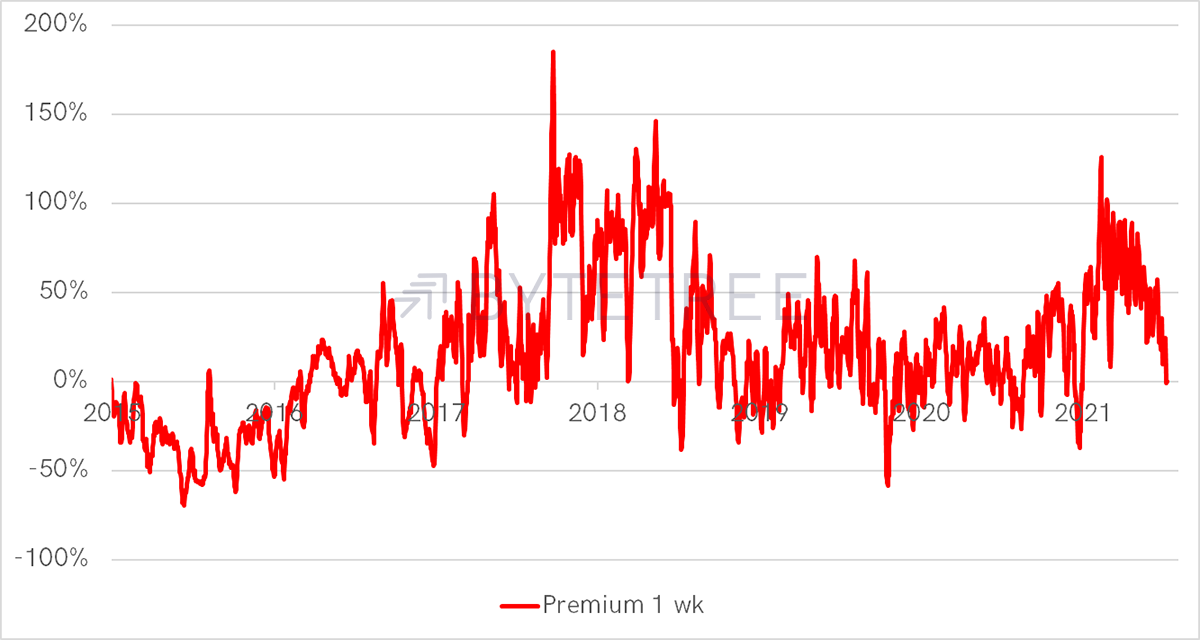
Source: ByteTree. Premium 1-week since 2015.
This is positive, but it justifies the current reading of 17.5 weeks simply because it has been sustained over the past two years. That might prove to be correct, and I believe it will be, provided the network doesn’t suffer a 2014 or 2018 wipeout.
But it may equally prove incorrect. We just need to avoid the network wipeouts. It always comes back to that.
These charts differ slightly from the live charts on the site for various reasons. The next upgrade will see this version, along with others, added.
Investment flows
When highlighting the narrowing of the Grayscale discount (GBTC), we spoke too soon. It touched 20% on Friday, which is fairly depressing for shareholders.
GBTC discount remains wide
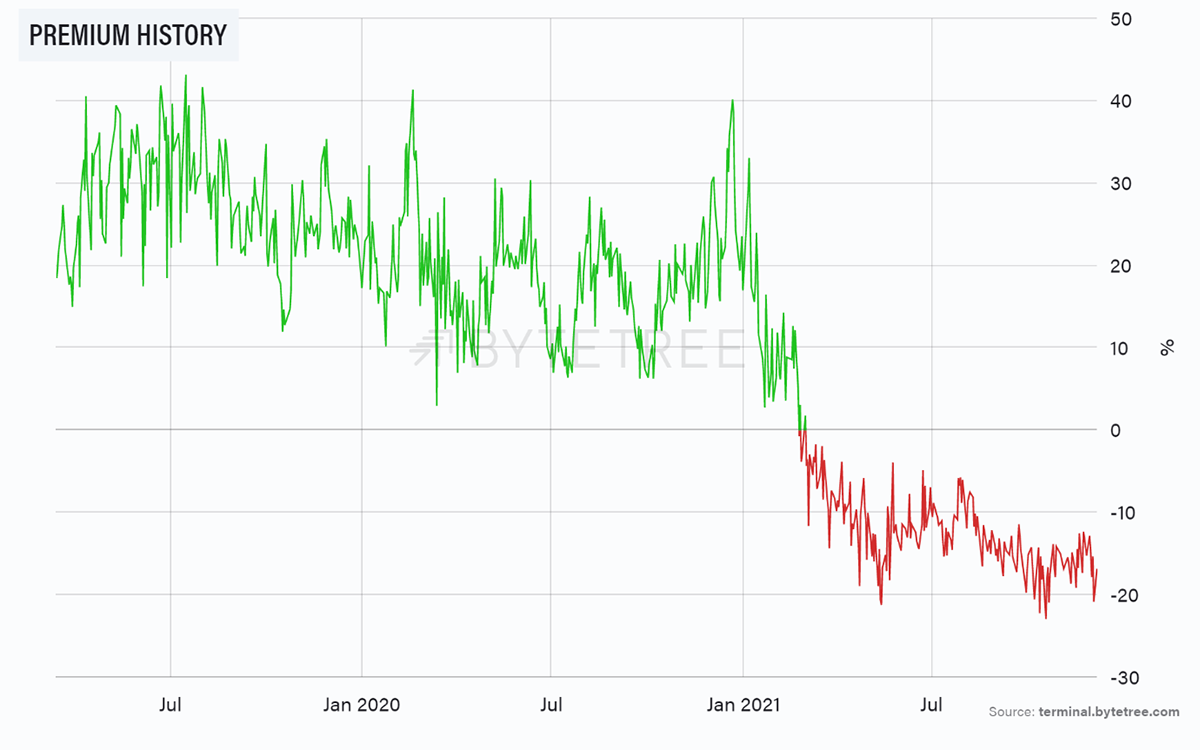
Source: ByteTree. GBTC premium history since March 2019.
If institutional investors are buying, 20% is an attractive discount unless you don’t trust Grayscale ever to close it. We are sceptical they can, but in any event, a tighter market would see a narrower discount.
Macro
In recent weeks, we have looked at the dollar (too bullish for comfort), rates (tapering unhelpful) and inflation (will return with a vengeance). This week I show the Goldman Sachs unprofitable tech index. It’s not crypto but a gang of speculative tech stocks that is not dissimilar from a behavioural perspective.
A year ago, 100% of them were above their 200-day moving average. Today that is 18%, and the index has made a new low. The ByteTrend score is 0/5.
Unprofitable tech is weak
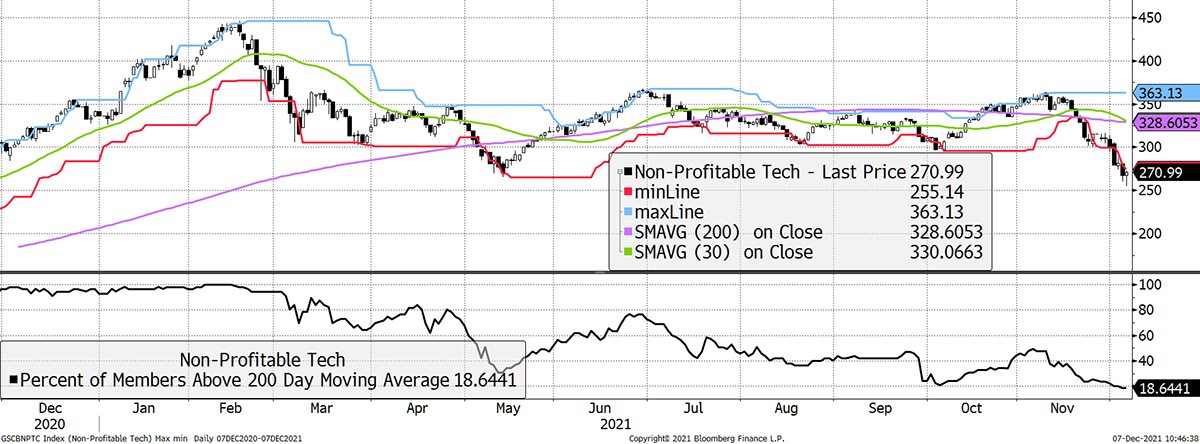
Source: Bloomberg. GS non-profitable tech index past year.
Can crypto defy weakness in speculative assets? That’s what the mega bulls believe. Probably hopeful.
Summary
The dark forces are coming, which is a cause for concern. But against that, the network has enjoyed a strong recovery. Assuming that holds, then the bulls may be right.

