Week 49 2021
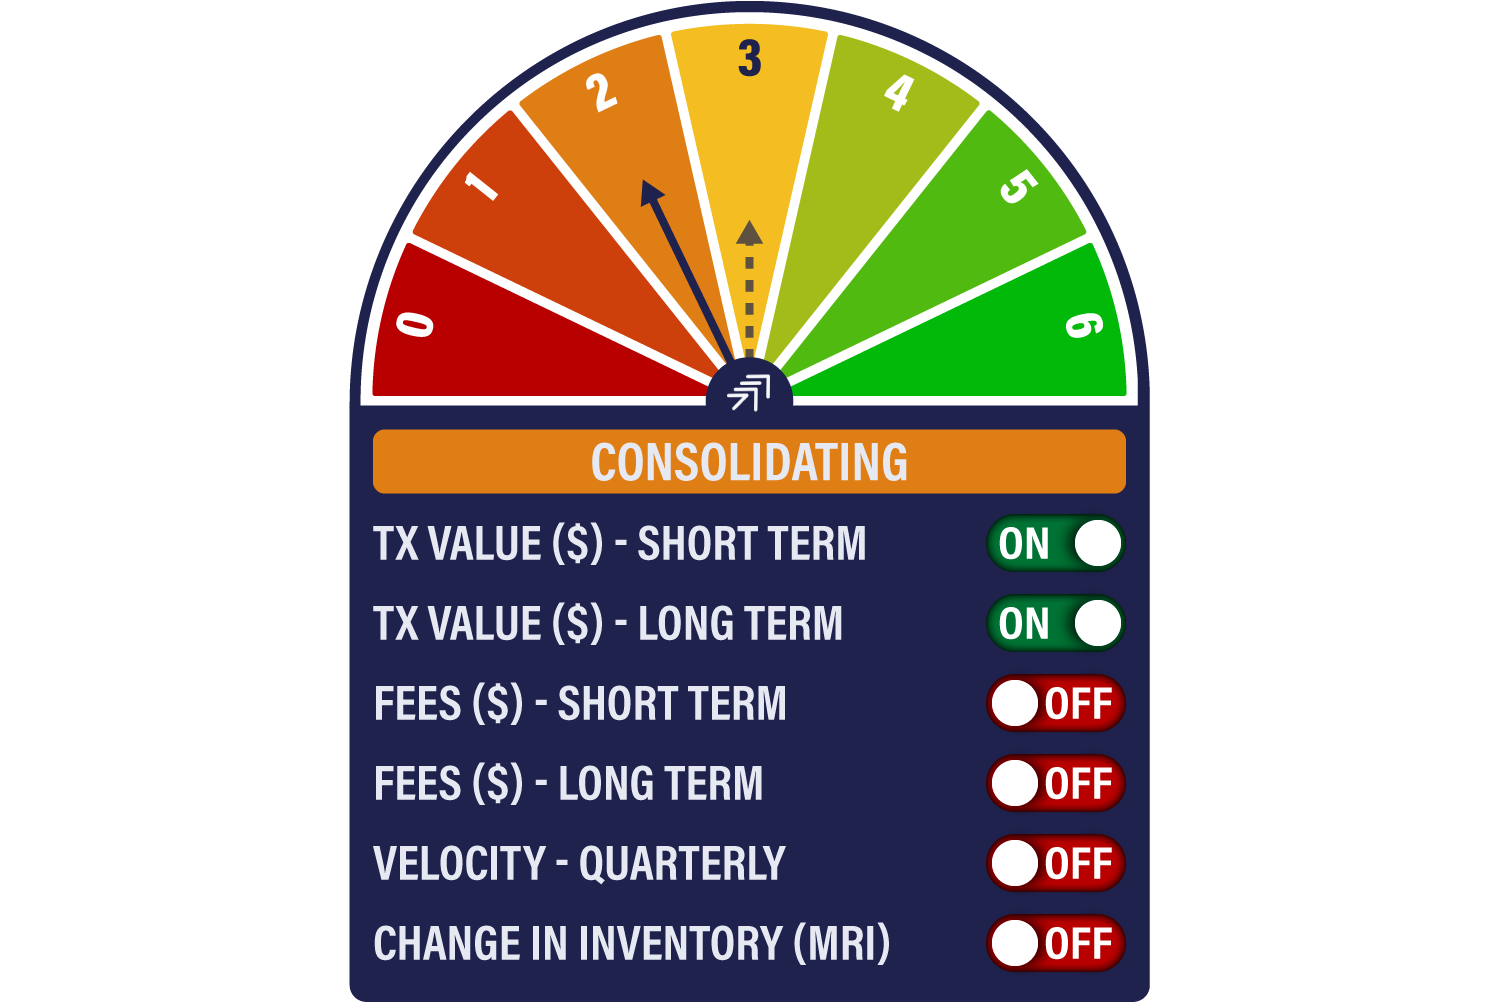
The Network Demand Model has fallen back to 2/6 from 3/6 last week. While long-term and short-term transactions are both positive, the Miner’s Rolling Inventory indicator turns off again.
We’ve discussed miner behaviour many times before. Short-term, the inclination to hold can be interpreted either way. Either they are sufficiently bullish about the market to HODL, or there isn’t a strong enough bid in the market to absorb the supply. It would be worrying if the miners start to sell more aggressively into this latest bout of weakness, but we aren’t seeing this yet.
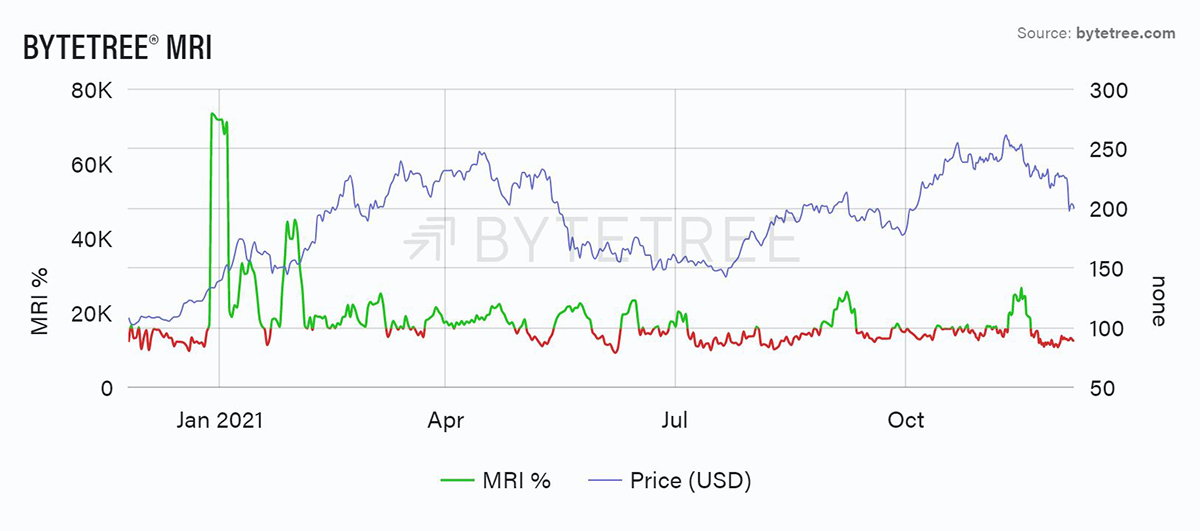
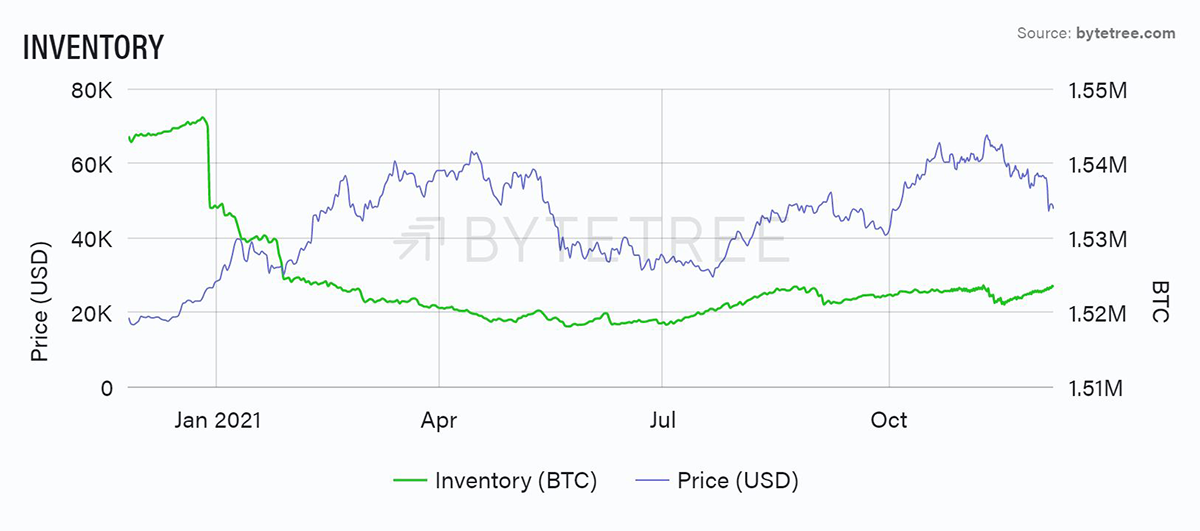
The above chart shows a year of two halves. The miners unloaded inventory in the first few months, corroborating the thesis that they sell into a strong bid. Since mid-July, however, they have been in holding mode and building up inventory. It might be different this time though. This period coincides with the collapse of mining in China, and the emergence of well-funded miners in the US (in particular) who have the balance sheet strength to take a more speculative approach. In fact, the only two times that MRI has surged in the second half of this year has coincided with material price weakness.
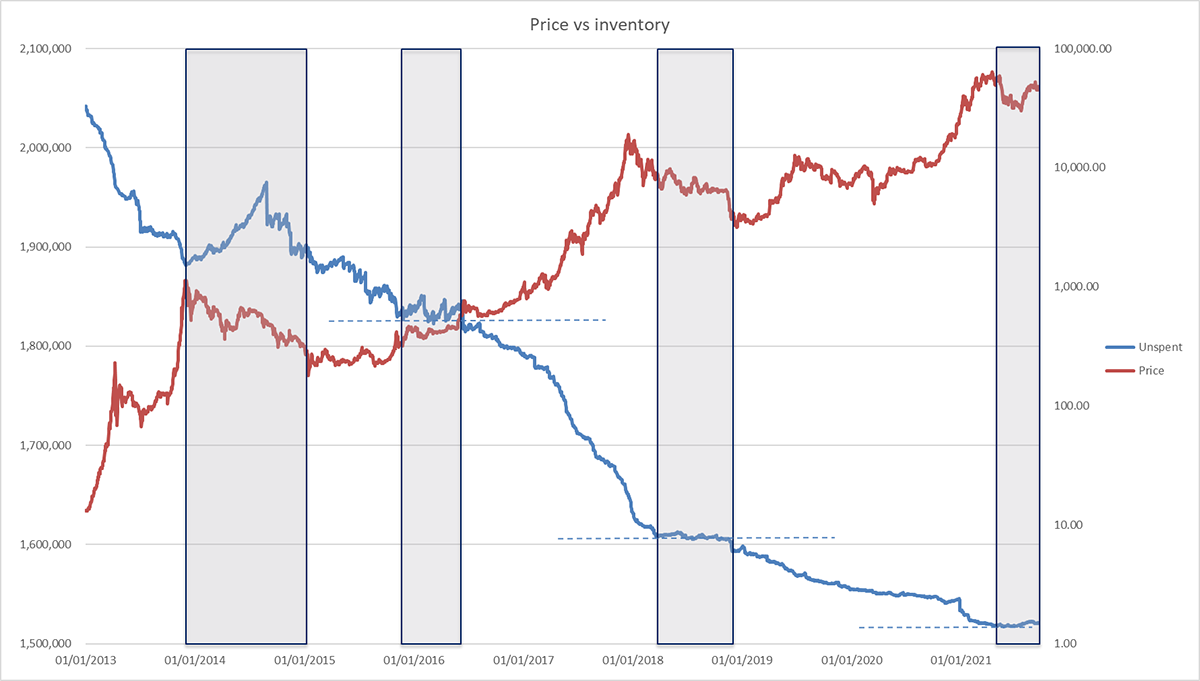
As shown above, long-term bull markets have normally been accompanied by falling miner inventories. If we are entering a bear market, genuine lows will almost certainly be heralded by a capitulation in the miners’ determination - or ability - to hang on. However, as per the chart below, we continue to see inventories rise. This is not a source of comfort.