Ethereum Makes an All-Time High

Disclaimer: Your capital is at risk. This is not investment advice.
ATOMIC 22
The primary source of risk-on, risk-off information comes from US Treasuries, which drive asset prices around the world. The “curve” sums the 10-year inflation expectation with the 10-year bond yield and shows strong correlation with bitcoin. The bad news is that both inflation and rates have recently cooled.

Highlights
| Technicals | Strong, need to confirm the all-time high |
| On-chain | Strongest since May, with premium down to 80% |
| Macro | Risk-off is the danger |
| Investment Flows | Strong and exceeding miner sales |
| Crypto | Ether College |
ByteTree ATOMIC
For the first time since the spring, the metrics look good. Bitcoin still trades at an 80% premium to the network activity. This measure is calibrated by historic realisations. Since 2011, Bitcoin’s market cap has ranged between 5 and 20 times the weekly transaction value. Currently, this is 24 times, having touched 35 in July.
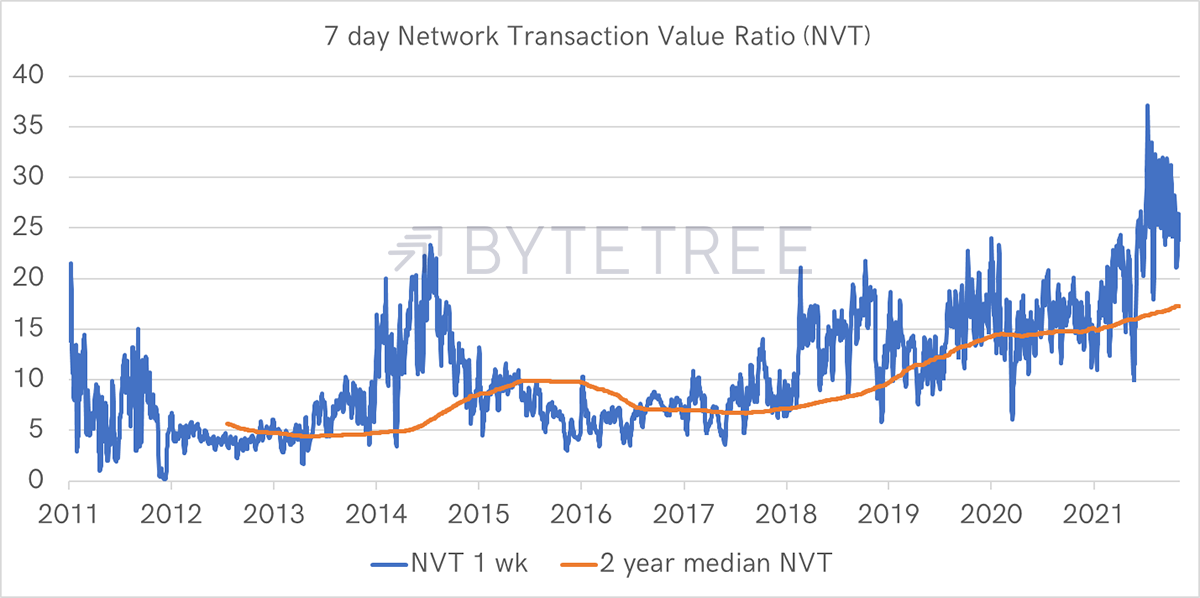
Source: ByteTree. Bitcoin adjusted market cap ($) divided by one-week transaction value ($) since 2011.
In the past, we have only seen an NVT of 20 breached on a few occasions, most notably in 2014, although it did become more normal from 2018.
Post-April 2021, the blockchain has seen a regime change, and much higher NVT readings are being sustained.
It could be that the NVT, as measured by the two-year median, will rise in line with bitcoin’s institutionalisation or mass adoption. We sympathise with that view. Not knowing what NVT constant to use, we opted for a two-year trailing median. This allows for structural change while highlighting short-term deviations - and our estimated fair value with it.
Equally, the high NVT could be telling us that bitcoin is ultra-expensive, and when the next financial market crisis comes, there could be a brutal downward adjustment.
It would be strange for an indicator that worked so well for a decade to suddenly become side-lined or irrelevant. But this is an emerging asset class, and as a result, there are unknowns.
Many in the crypto space would tell you Bitcoin is cheap on this basis because they look at questionable sources. I show two similar calculations from competitors’ data. In both cases, the NVT number is below the highs seen in the spring, leading many to believe bitcoin was cheap in July.
We have highlighted before how we believe their calculation for transaction value is incorrect, which is instrumental in accurately calculating this important metric. Recall that in August last year, ByteTree changed its methodology in response to the growth in CoinJoin transactions that were skewing results.
After kicking the tyres, again and again, we are as certain as we can be that our data is accurate. We take comfort that it closely matches data from Blockchain.com, who were the first to calculate transaction value back in 2013.
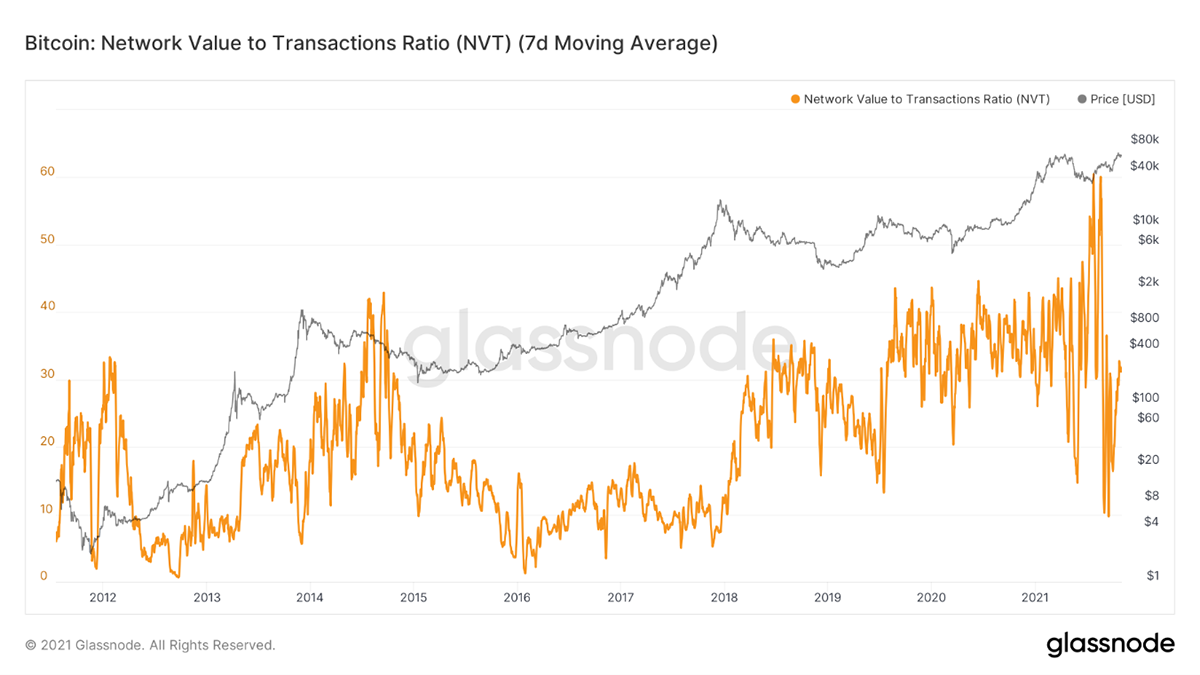
Source: Glassnode Studio. Bitcoin Network Value to Transaction Ratio (NVT) (7d Moving Average).
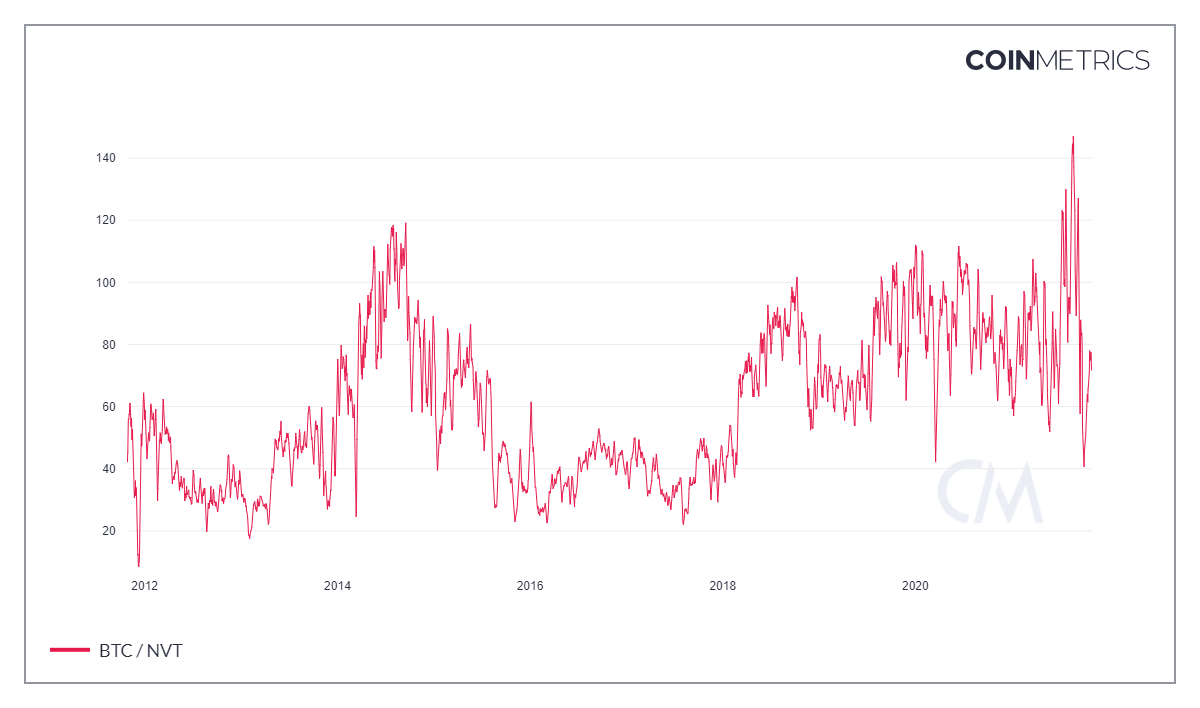
Source: CoinMetrics.
There’s a big difference in the data since August 2020. Choose your data source carefully.
Technical
BTC and ETH both have ByteTrend scores of 5 out of 5, and ETH just made an all-time high.
BTC trend remains strong
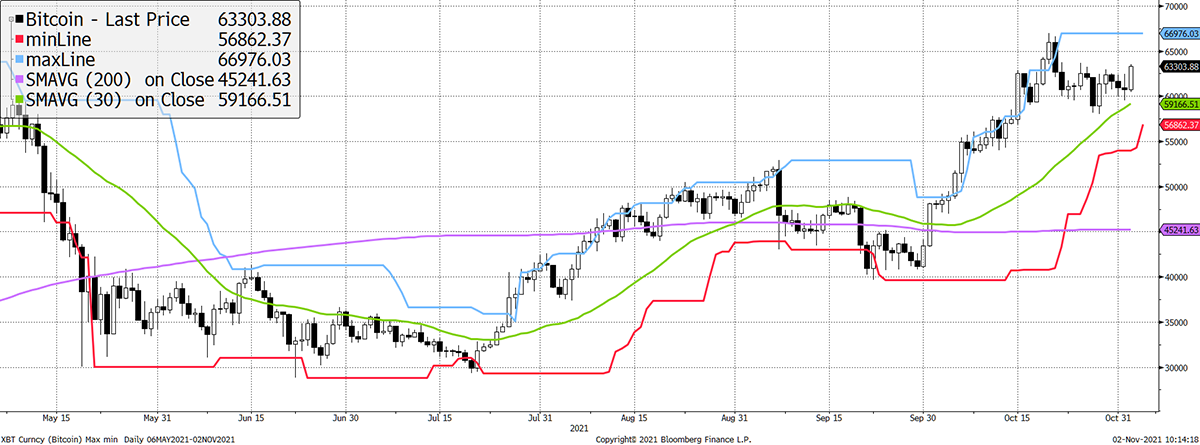
Source: Bloomberg. Bitcoin with 20-day max and min lines, 30-day and 200-day moving averages past six months.
ETH scores 5 with a stronger 200-day ma
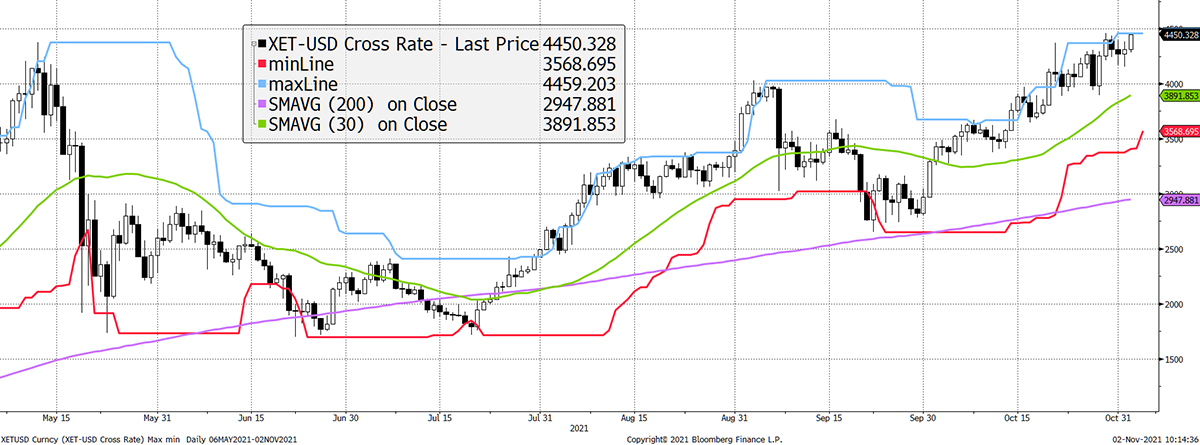
Source: Bloomberg. Ethereum with 20-day max and min lines, 30-day and 200-day moving averages past six months.
The relative trend, using ByteTrend, is strong. ETH now scores 5 out of 5 when priced in BTC. It’s a winner.
ETH remains in a strong relative trend
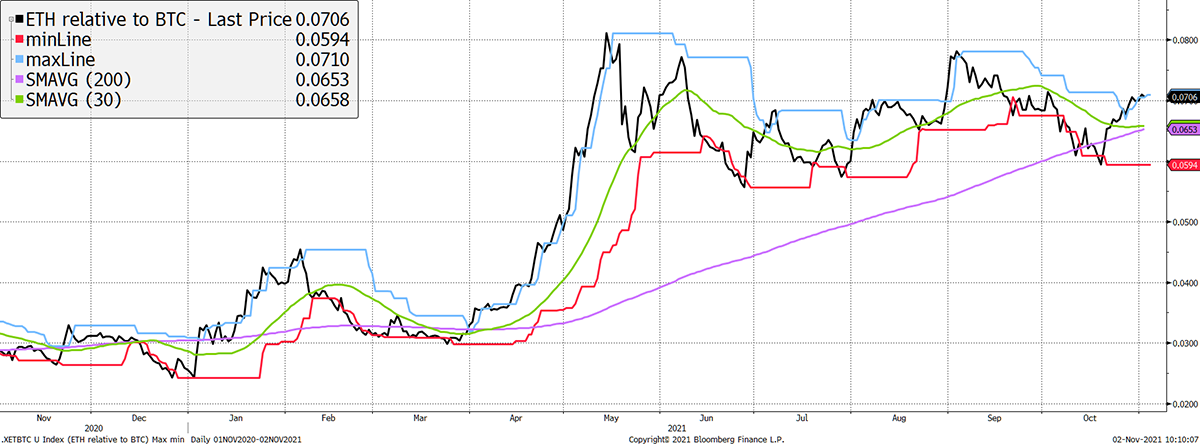
Source: Bloomberg. ETH in BTC with 20-day max and min lines, 30-day and 200-day moving averages past six months.
ByteTrend explained:
We urge you to become familiar with the ByteTrend score concept because it will become a major feature in ByteTree technical research. Quite simply, it enables a trend to be quantified, which helps to remove emotion and provide a comparison across many charts for cross-market screening.
A ByteTrend score gets a point for each of the following criteria:
- Price is above the 200-day moving average
- Price is above the 30-day moving average
- 200-day moving average slope is rising
- 30-day moving average slope is rising
- The last touch of the max/min lines was blue
On-Chain
Mining difficulty rose again as expected and is nearly back to the pre-China-bans-bitcoin levels. That tells you that mining remains highly profitable, especially at their newfound locations that tend to harness cheap, surplus energy.
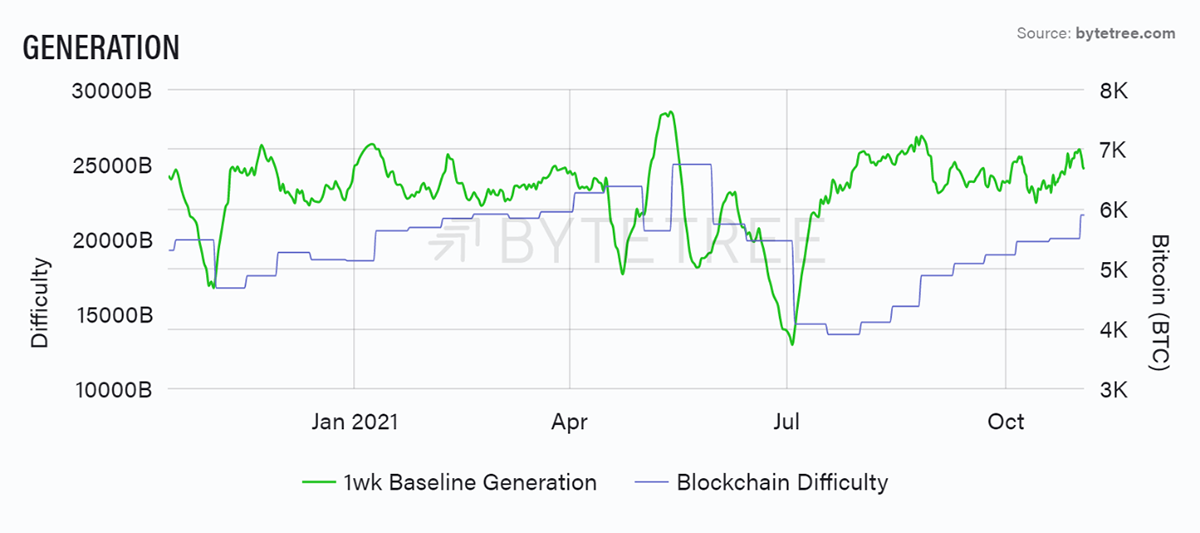
Source: ByteTree. 1-week generation (green) and the blockchain difficulty (blue) over the past year.
And it’s going to get even more difficult. Over the last 24 hours, the average block time was 557 seconds, still 7% below the 600-second target.
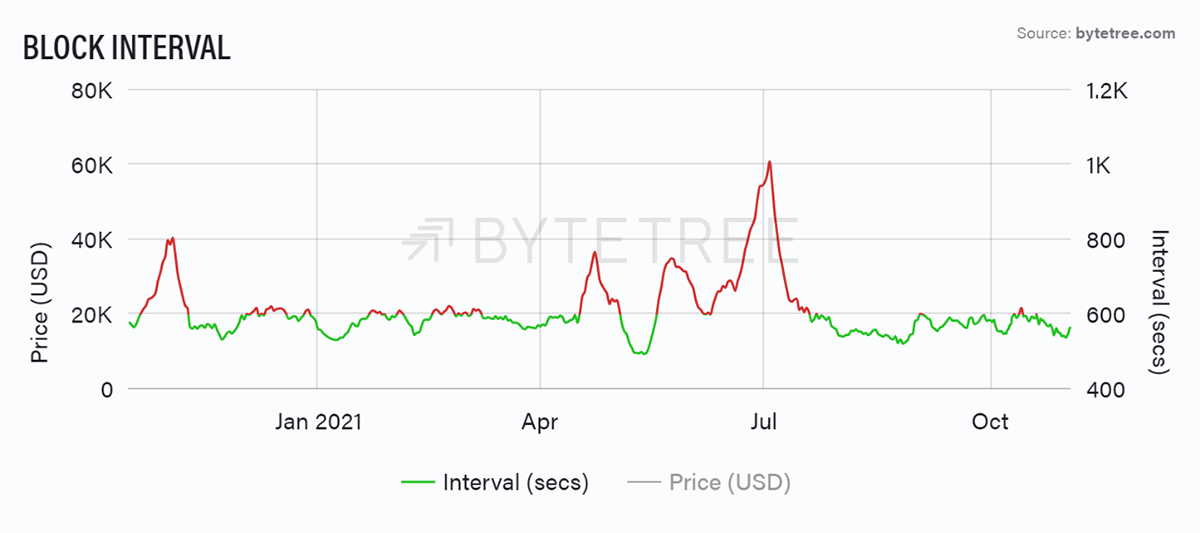
Source: ByteTree. Bitcoin block interval over the past year.
In the face of light transactions, these excess blocks are holding down fees as there is currently a surplus of blockchain capacity. As a result, the current low fees are understating demand.
Investment Flows
This is one of ByteTree’s finest charts. It has turned green over 30 days, which means the recent flows into the ETFs have exceeded the miner selling. That can be a hugely positive force on the network and arguably was the driver of the rally between October 2020 to March 2021. After all, it led the rally by scooping up all of the available bitcoin and then some.
Bitcoin ETF flows turn green
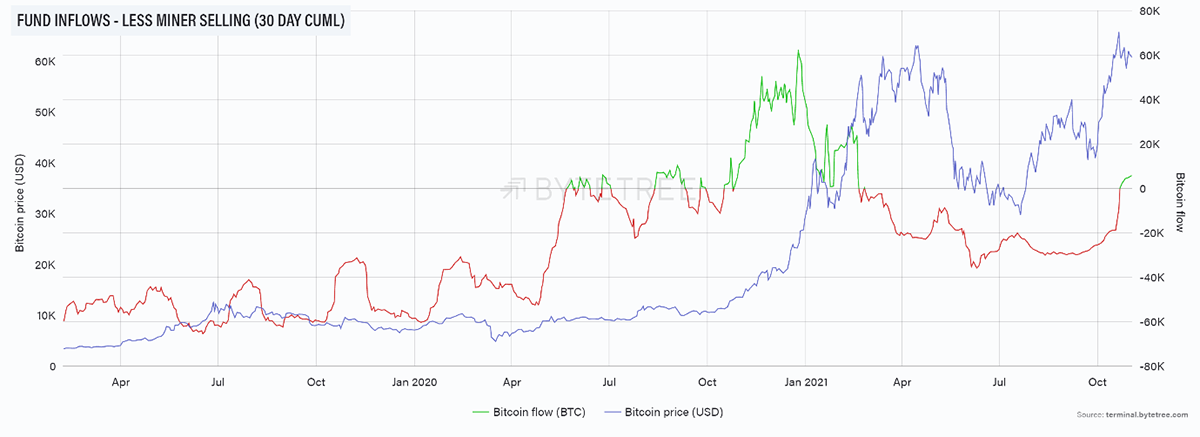
Source: ByteTree. Bitcoin fund inflows (BTC), less miner selling, 30-day cumulative, and the price of bitcoin (USD) since February 2019.
It is more volatile over 7 days and shows the 19,046 (estimate) of flows into the ProShares Bitcoin Futures ETF (BITO). Valkyrie (BTF) came later but only managed 851 BTC (estimate).
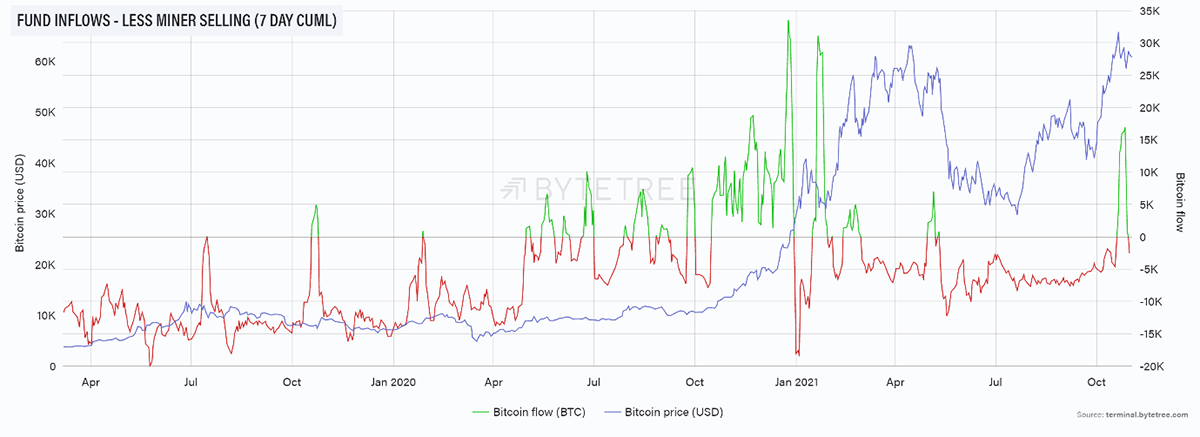
Source: ByteTree. Bitcoin fund inflows (BTC), less miner selling, 7-day cumulative, and the price of bitcoin (USD) since February 2019.
A couple of weeks ago, I highlightedhow these futures ETFs would make excellent trading vehicles and open a welcome conduit to Wall Street, yet fail as asset gathering vehicles due to the heavy drag from the roll yield. After a mammoth sprint in the first three days of trading, inflows have already stalled.
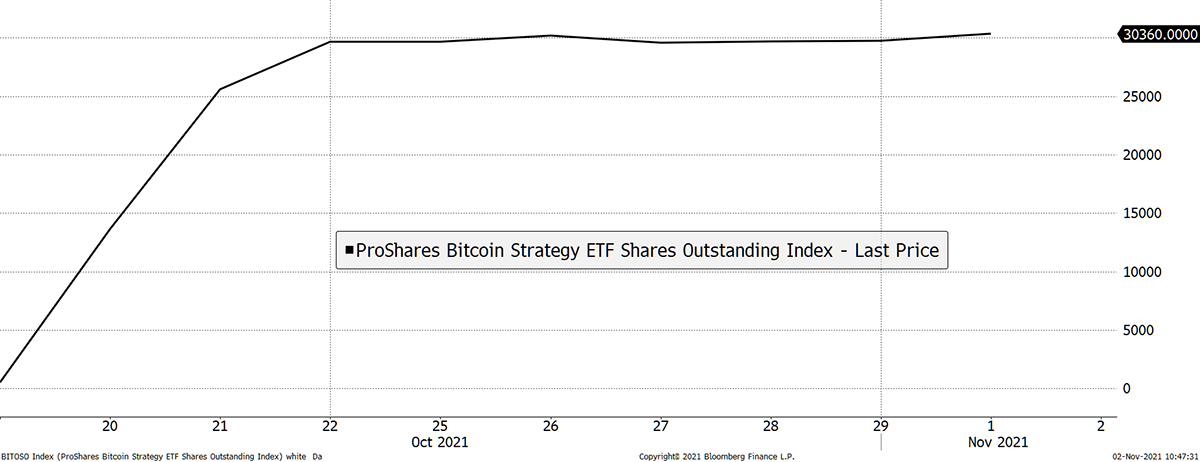
Source: Bloomberg. ProShares Bitcoin Strategy ETF shares in issue.
Yet, the average ETF has turned green, which means they are collectively growing again. That is good news.
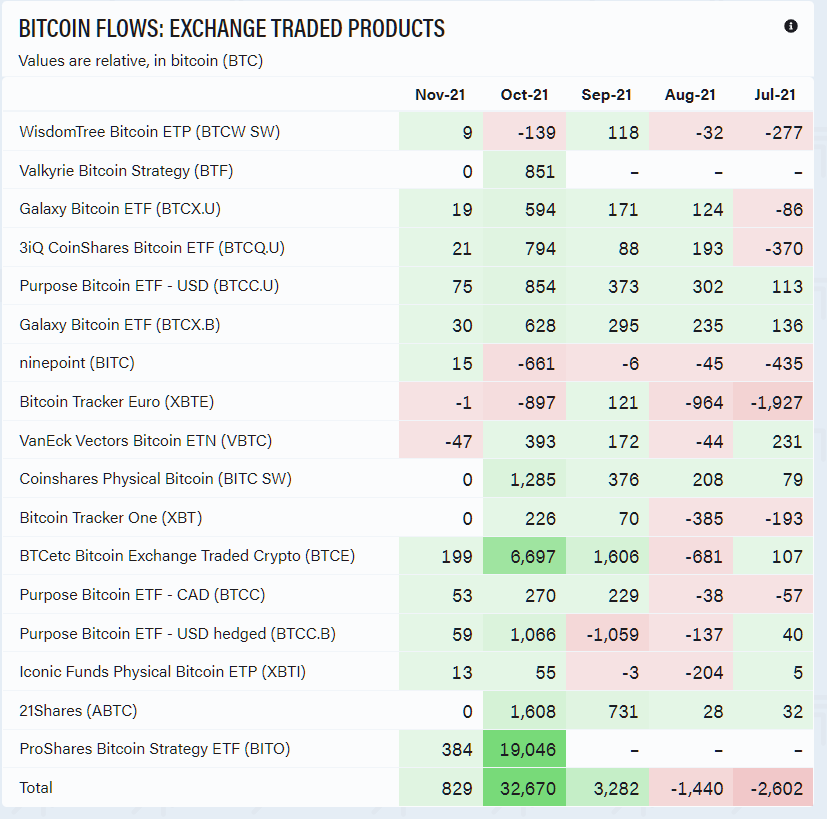
Source: ByteTree. Bitcoin ETF fund flows (BTC) since July.
Ether flows are also growing. New supply is around 167,000 ETH per month, with fund inflows running at 35,000 ETH.
Macro
Just for fun, I’ll show you GBPJPY against bitcoin. It’s a remarkable fit.
Bitcoin = GBPJPY + leverage
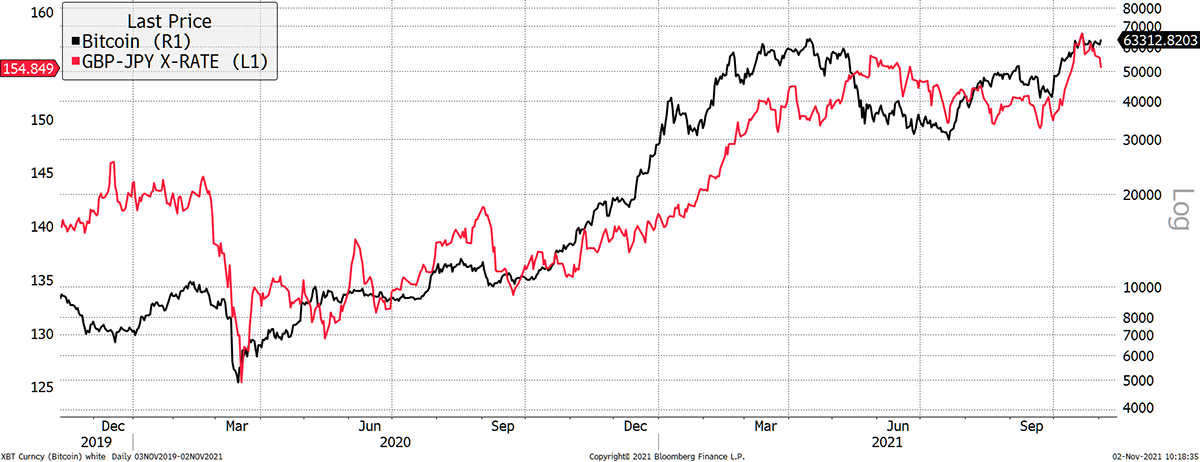
Source: Bloomberg. As described over the past two years.
There’s logic to this seemingly random walk. The pound is generally a risk-on currency, while the yen is a risk-off. It stands to reason that GBYJPY would correlate with things like the 10-year yield, equities and many other things. It is a reminder of how sensitive all prices are to macro forces. But it is amusing to think that what is good for the pound is good for Bitcoin. Tell that to the Bank of England.
The primary source of risk-on, risk-off information comes from US Treasuries, which drive asset prices around the world. The “curve” sums the 10-year inflation expectation with the 10-year bond yield and shows strong correlation with bitcoin. The bad news is that both inflation and rates have recently cooled. Pray this changes.
A cooling curve

Source: Bloomberg. Bitcoin and the curve (10-yr breakeven plus 10-yr yield) over the past year.
This remains the killer chart to compare the new world to the old: Bitcoin futures (spot without the roll) against NASDAQ futures. BTC has a ByteTrend score of 5 on that too.
Bitcoin beating the Street
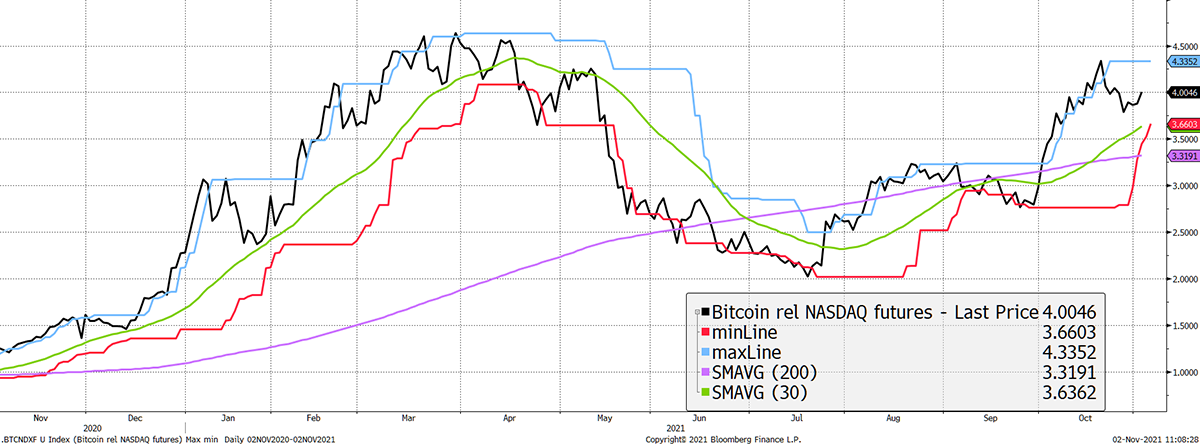
Source: Bloomberg. BTC futures relative to NASDAQ futures with 20-day max and min lines, 30-day and 200-day moving averages past year.
Ether College
- by Tom Salter and Aun Abbas
In forthcoming ATOMICs, we will educate our readers on the second-largest digital asset, Ethereum.
Ethereum is the most valuable smart contract blockchain, with a market cap of $550bn. Smart contracts enable networks to process complex transactions. These transactions are the basis of sectors such as decentralised finance (DeFi) and non-fungible tokens (NFTs), of which Ethereum dominates both.
How We Value Ethereum
Bitcoin and Ethereum are inherently different and therefore cannot be valued in the same way. From a high level, we look at four general metrics to evaluate the health of the Ethereum Network.
1. Number of Transactions
This metric simply looks at the number of times users transact over the Ethereum Network. When analysing Ethereum, steady growth is preferred because spikes can bottleneck the network, specifically by causing high network fees.
In July 2017, Ethereum flipped Bitcoin regarding the number of transactions, and the gap has only widened since.
2. Gas Fees
‘Gas’ is a network fee every Ethereum user must pay. The fee amount is usually denominated in “gwei” (1 gwei = 0.000000001 ETH), which is comparable to Bitcoin’s ‘satoshi’. Think of gas as a fee that compensates Ethereum miners for their computational power when processing your transaction. It is a fundamental part of the proof-of-work consensus model which secures Ethereum’s virtual machine (EVM).
3. ETH Market Cap Relative to Token Market Cap
Ethereum is best known for its token standards. These build specifications must be obeyed to operate on the Ethereum blockchain. ERC-20 and ERC-721 are the most popular types of tokens, corroborated by the fact that 24 of them are in the top 100 digital assets by market cap.
In total, the combined market cap of these tokens is $150.21bn, which is 3.52x smaller than the market cap of Ethereum.
Few understand that these token standards are a token’s gateway to a highly liquid, trillion-dollar market Ethereum Network. The network where they have the best chance of succeeding.
4. ETH TVL Relative to ETH Killers
Ethereum’s inefficiencies and the plethora of opportunities in the dApp space have brought ‘ETH Killers’ to the forefront. ETH Killers are competing smart contract blockchains aiming to extract value from the Ethereum market by capitalising on Ethereum’s high-cost network.
Relative Total Value Locked, TVL, is an excellent metric for showing the growth of ETH and competing smart contract blockchains. TVL represents the funds held by a blockchain’s smart contracts at any given time. Currently, ETH’s TVL dominance is 67%, and its TVL is twice the size of all ETH Killers’ combined TVL.
That said, the fact that we are yet to find a true contender plays into the hands of the multi-chain paradigm theory. More will be discussed next week.
Summary
With money coming in and the blockchain ecosystem fully repaired, it all looks good. When you consider that Tesla is worth over a trillion, that surely makes bitcoin deep value? Good logic at least.
