Week 48 2021
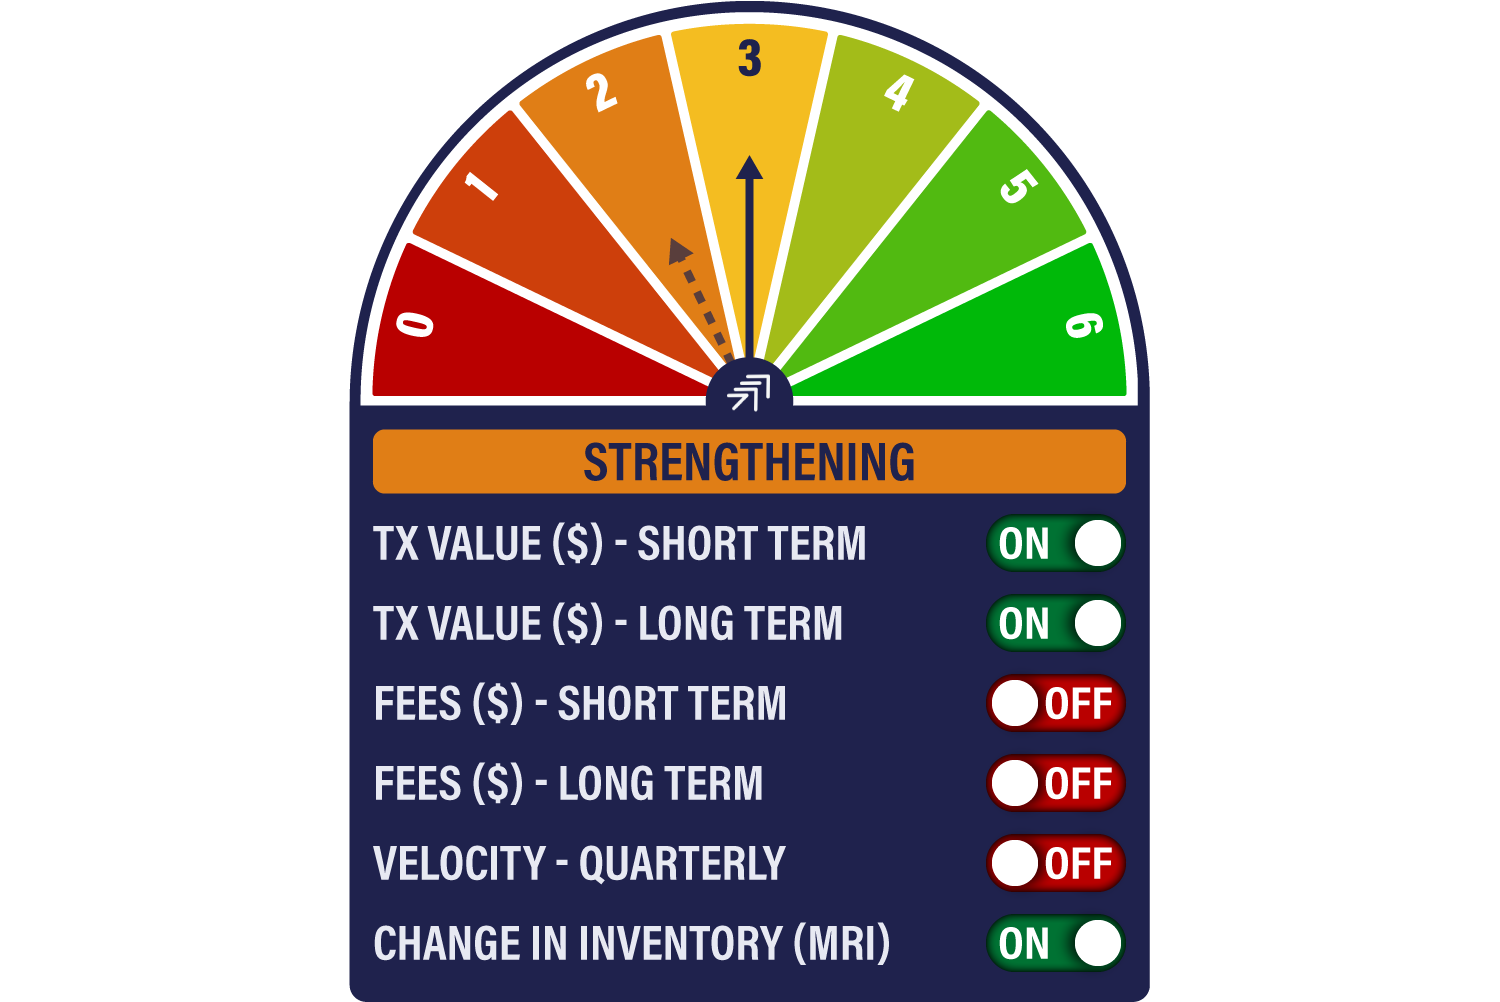
The Bitcoin Network Demand model has perked up again this week, with stronger transaction data taking the score to 3/6 from 2/6. The short-term spend signal has turned back on, as did the Miner’s Rolling Inventory, the latter after a brief intra-week dip.
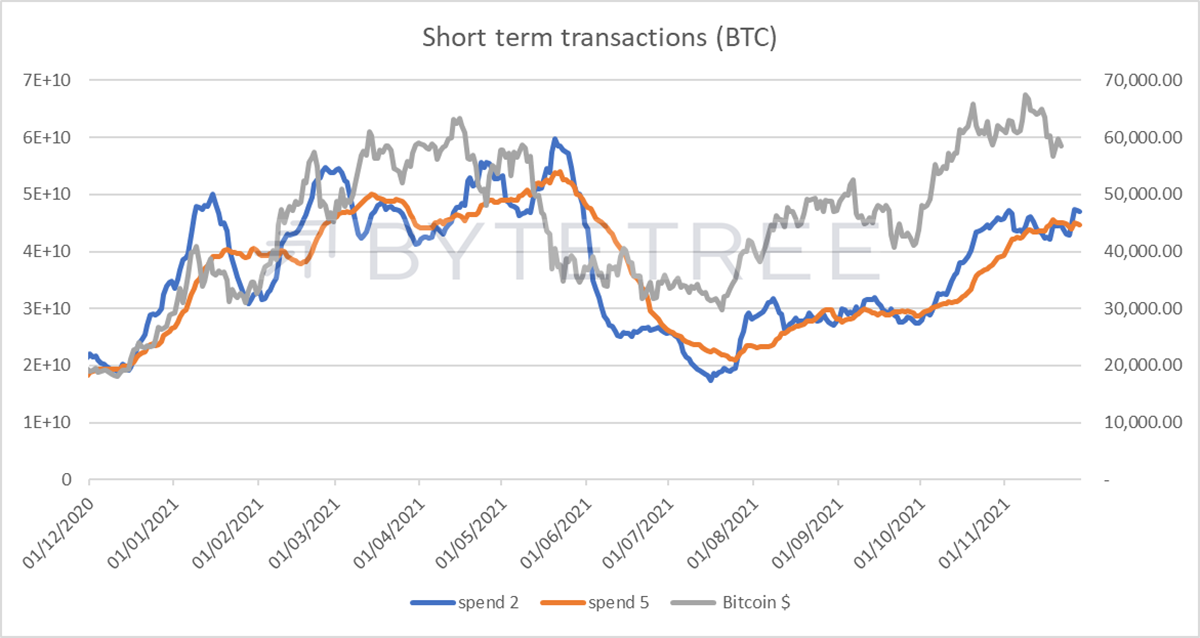
Short-term spend has turned positive again, as can be seen in the chart below. This is the most volatile signal, and as such, is somewhat noisy, but it can be a good early warning indicator. If you look carefully over the last year, the time to get nervous is if the orange line (5 weeks) starts to slope downwards. If, however, spend remains pretty steady during a price correction, it tends to herald a breakout to the upside. Recent activity is encouraging in that regard.
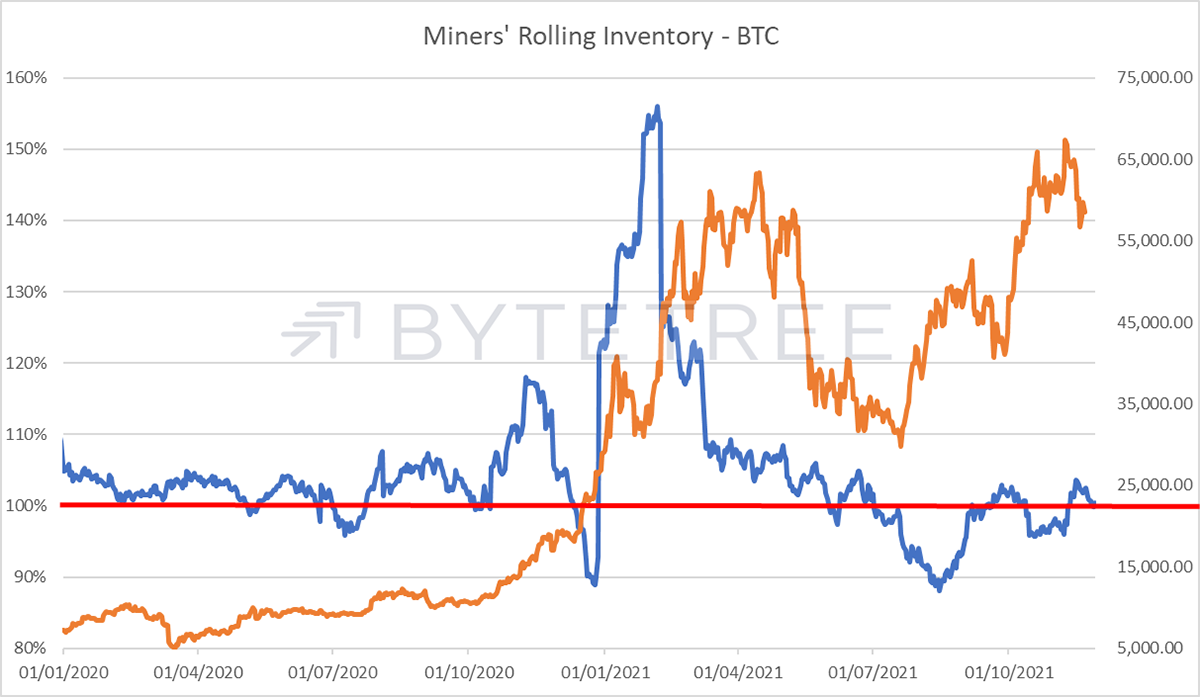
The miners continue to emit a mood of quiet confidence. They have been selling a bit more aggressively of late, which might coincide with renewed clampdowns in China and a regulatory clampdown in India. This appears to have mainly passed, as can be seen below, where the blue line has gravitated back towards the equilibrium level of around 100%.
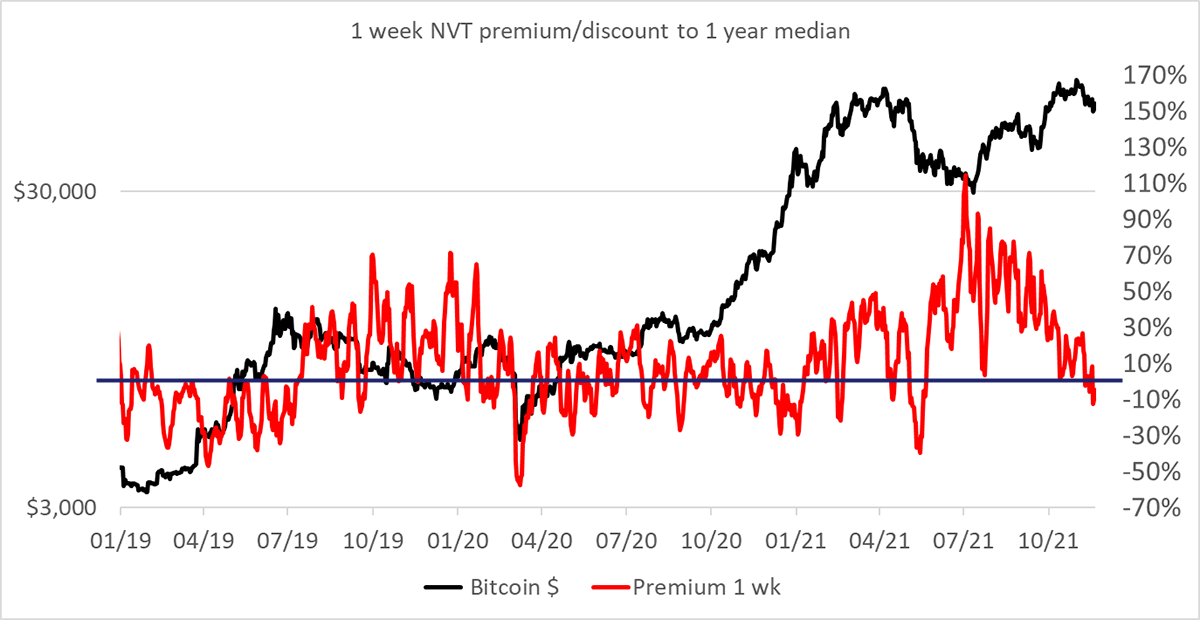
One chart that provides a high level of comfort, and one we haven’t shown for a while, looks at the 1-week rolling NVT (effectively bitcoin’s price to sales ratio) against the 1-year historic median. This shows us where bitcoin is trading against its own (recent) history. We postulated a couple of months ago that bitcoin could be justified in re-rating on account of
a) reduced reliance on China for both mining and trading, and
b) greater size, greater liquidity and more institutional adoption.
The chart shows us that bitcoin has very largely normalised against its more recent trading history. It’s not a nailed-on certainty from here, but over the last year, it’s generally worked out well if one has accumulated when the red line goes into negative territory.