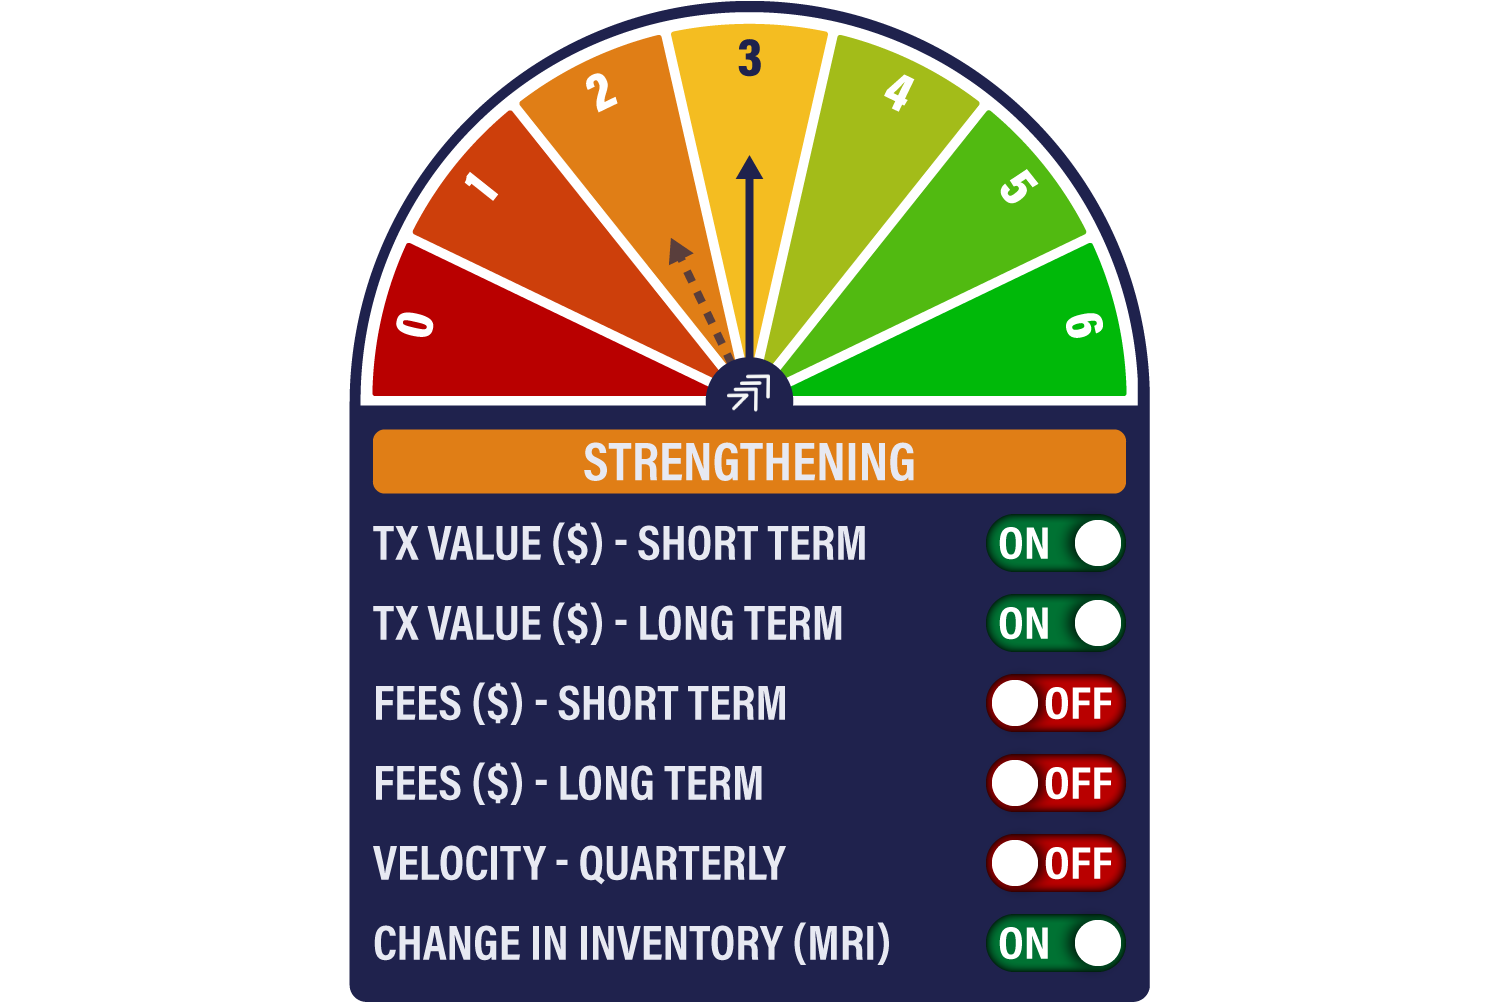
Week 46 2021
The BTC Network Demand Model moves from 2/6 to 3/6 this week. The change in the model is triggered by a sudden burst of miner selling, although transactions appear to be plateauing.
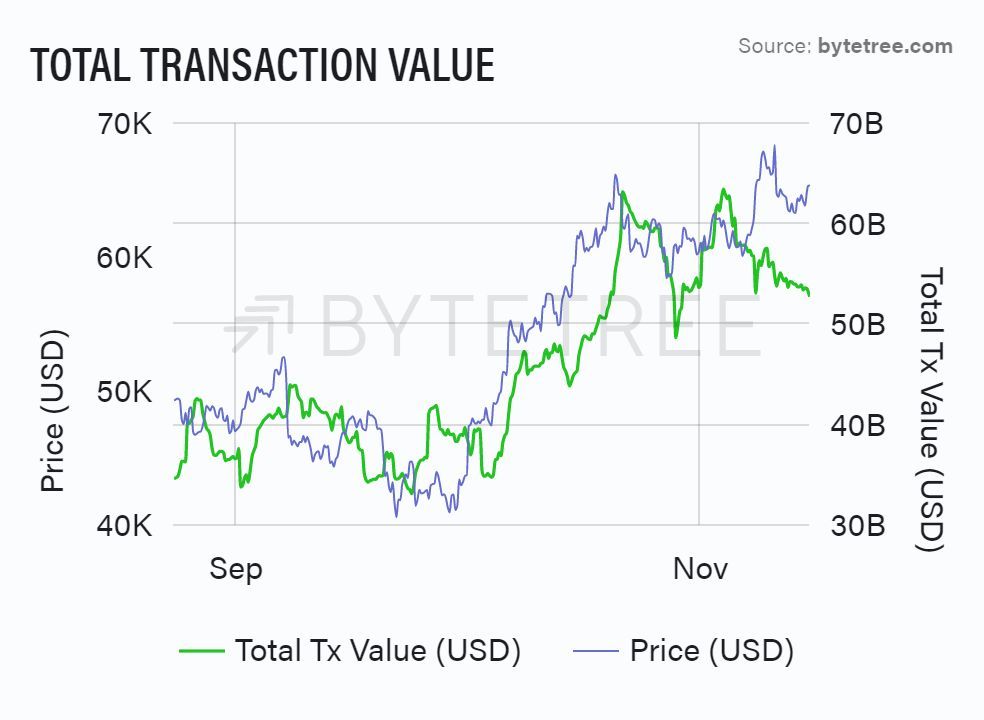
Transaction activity in the bitcoin network remains rangebound. As with any asset class, it’s a good sign to see the price moving higher in good volume. Similarly, if the price holds in a range as volume declines, we have little reason to be alarmed. That is where we are now. What we don’t want to see is a pick-up in transaction activity without a corresponding move in the price. This could suggest that we’ve reached an interim peak. Additionally, a more sustained decline in transaction value undermines the notion of a healthily growing network.
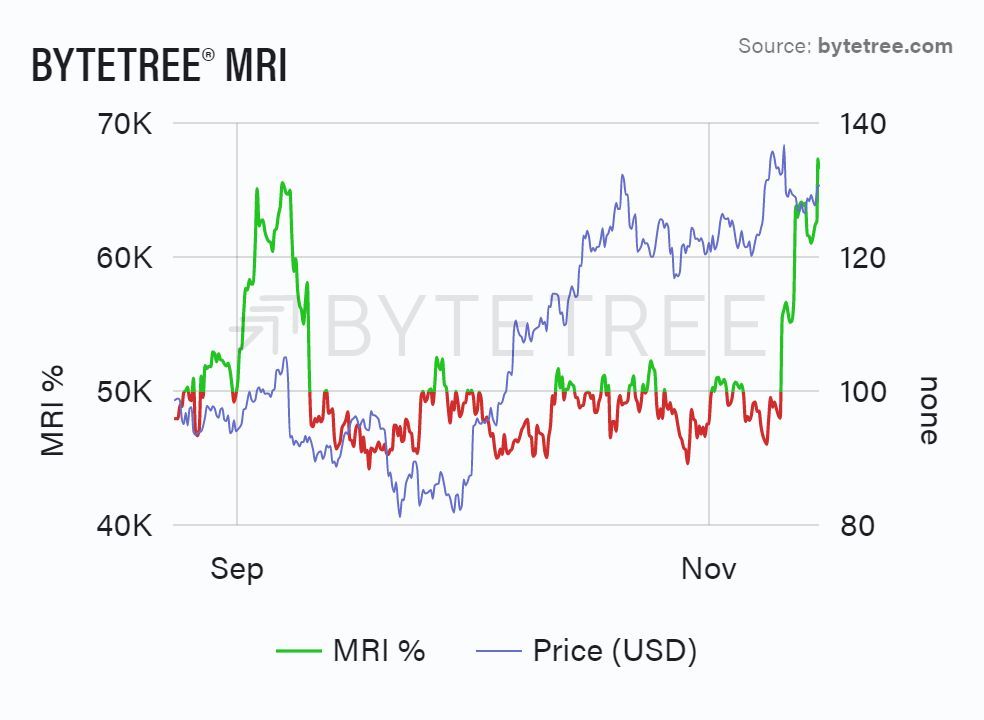
The ByteTree MRI signal has moved sharply higher. This means that the miners are off-loading inventory. History is ambiguous as to how we regard this. Over the long-term, the ability to sell inventory is a sign of a healthy market. Miners have tended to hoard in bear markets. Shorter-term, however, a spike in MRI can mark a temporary high. For example, this was the case in September, although it is encouraging that the market has absorbed this recent fresh supply with little price impact.