

ATOMIC 20
The Bitcoin ETFs are coming to America. Unfortunately, they only invest in futures as opposed to the real thing. Expect them to lag by 8.4% each year before fees.

Highlights
| Technicals | Strong but extended |
| On-chain | Improving data |
| Macro | Enjoying the inflation narrative |
| Investment Flows | Futures ETFs trade today |
| Crypto | The Alt rally falters |
ByteTree ATOMIC
Sometimes it’s better to travel than arrive. The market is full of hope, and there are plenty of reasons to keep a cool head.
Technical
In October, bitcoin smashed through the wedge highlighted a fortnight ago, taking the price back to the all-time high.
The bitcoin wedge
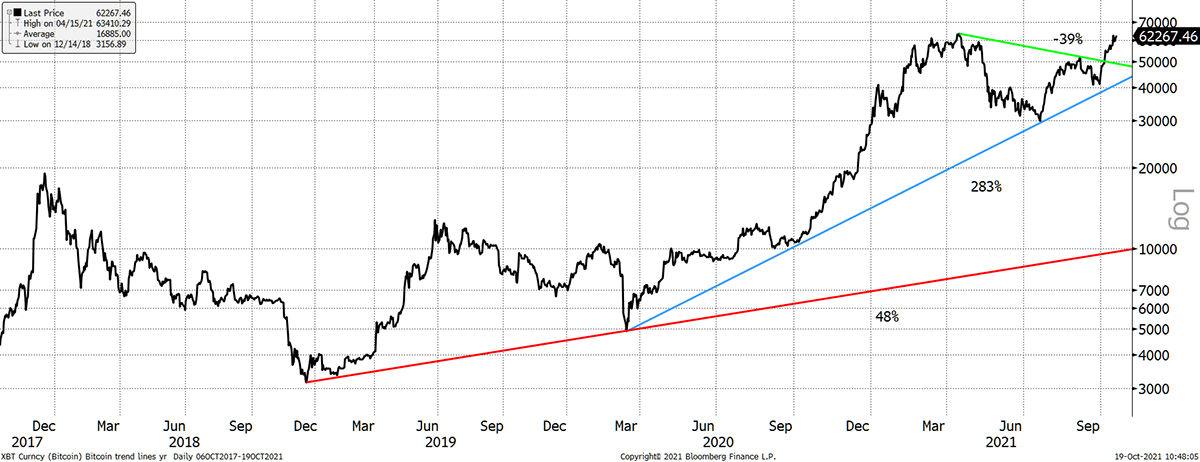
Source: Bloomberg. Bitcoin since 2017 log scale with trendlines since 2017.
Short-term, the 30- and 200-day moving averages are positively sloping, and the price is above both. The price has been steadily making new 20-day highs in October. The ByteTrend score is 5/5.
Strong trend
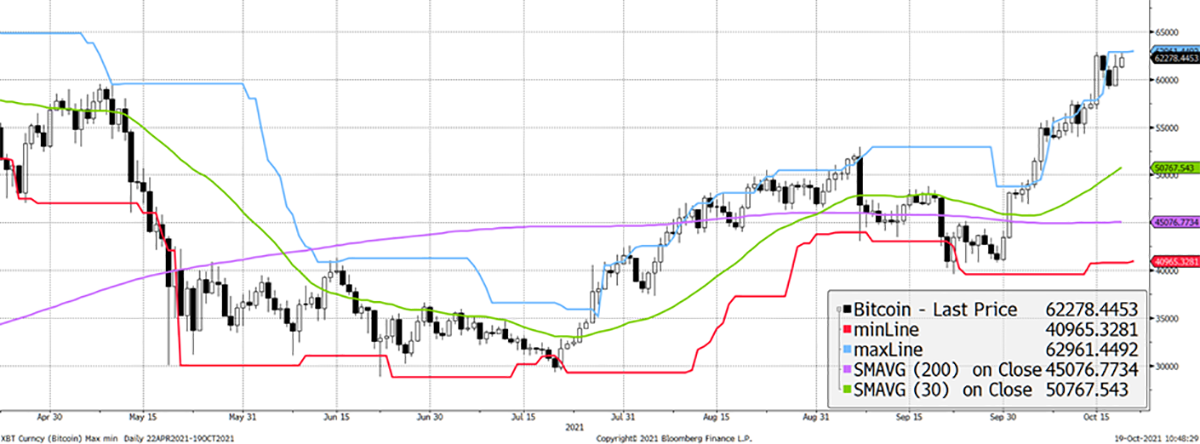
Source: Bloomberg. Bitcoin with 20-day max and min lines, 30-day and 200-day moving averages past six months.
ByteTrend explained:
We urge you to become familiar with the ByteTrend score concept because it will become a major feature in ByteTree technical research. Quite simply, it enables a trend to be quantified, which helps to remove emotion and provide a comparison across many charts for cross-market screening.
A ByteTrend score gets a point for each of the following criteria:
- Price is above the 200-day moving average
- Price is above the 30-day moving average
- 200-day moving average slope is rising
- 30-day moving average slope is rising
- The last touch of the max/min lines was blue
While the trend is strong, the bitcoin price is overbought. Price is 22% above the 30-day moving average.
Bitcoin is overbought
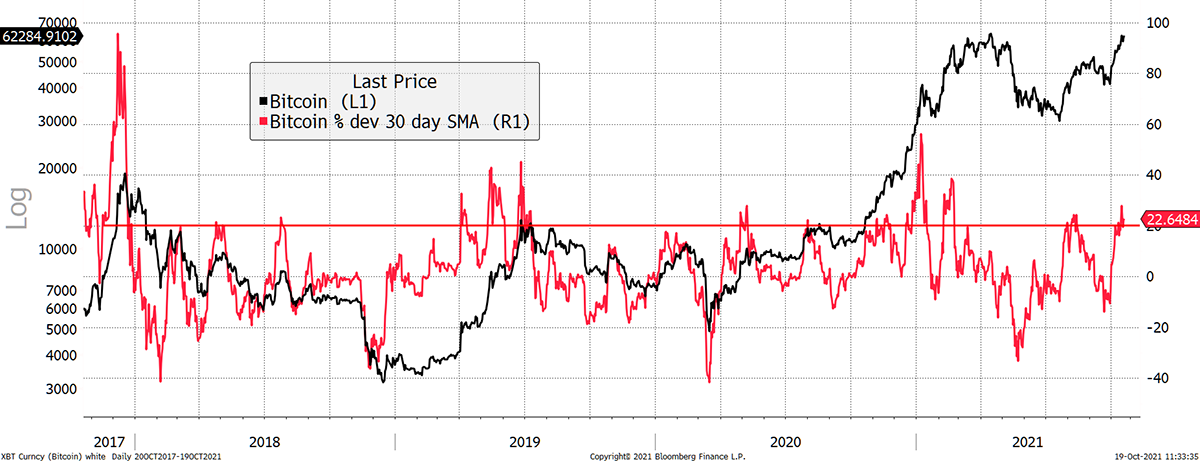
Source: Bloomberg. Bitcoin with % deviation from the 30-day moving average since 2017.
A quick backtest on that is surprisingly good as $100 becomes $687 since 2017, in contrast to buy and hold $3,377. Buying when the price is overbought certainly captures the mania rallies. Might we see one now? Maybe.
Buying bitcoin when the price > 20% above the 30-day moving average
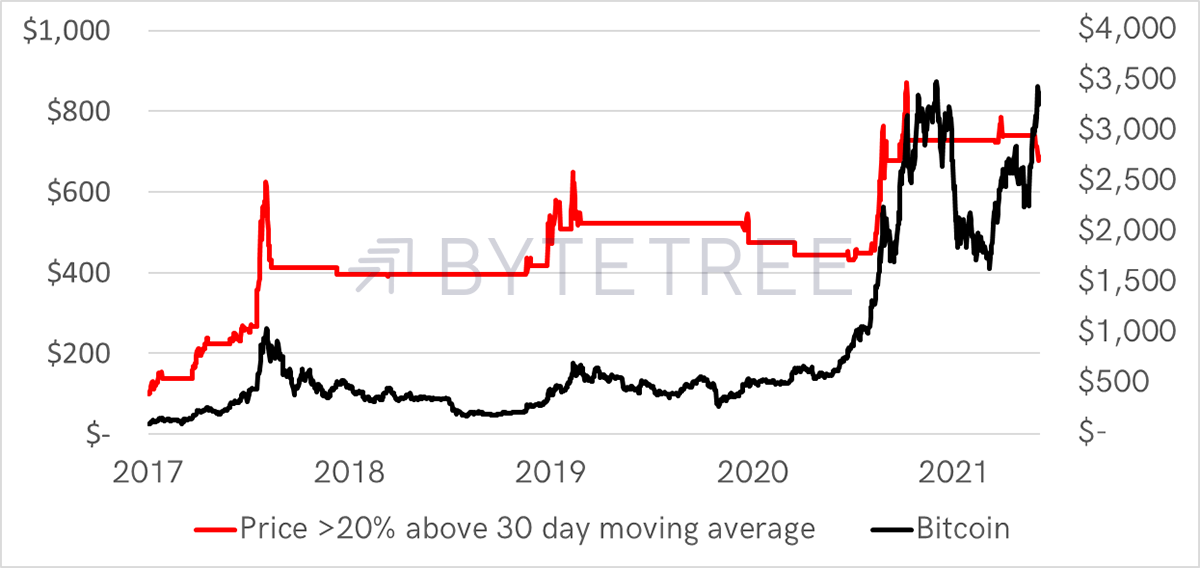
Source: ByteTree. $100 becomes for Bitcoin (rhs), when price > 20% above the 30-day moving average (lhs) since 2017.
On-chain
In the big scheme of things, fees remain remarkably soft given the price action, but at least they are rising.
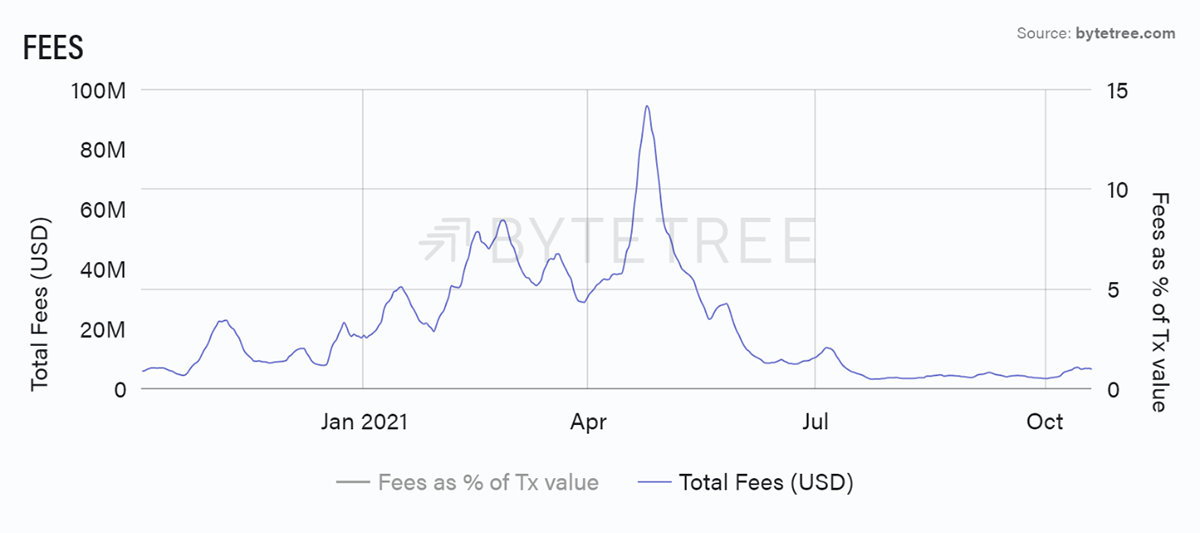
Source: ByteTree Terminal. Bitcoin Total Fees (USD) over the past year.
That said, they have cooled over the past week.
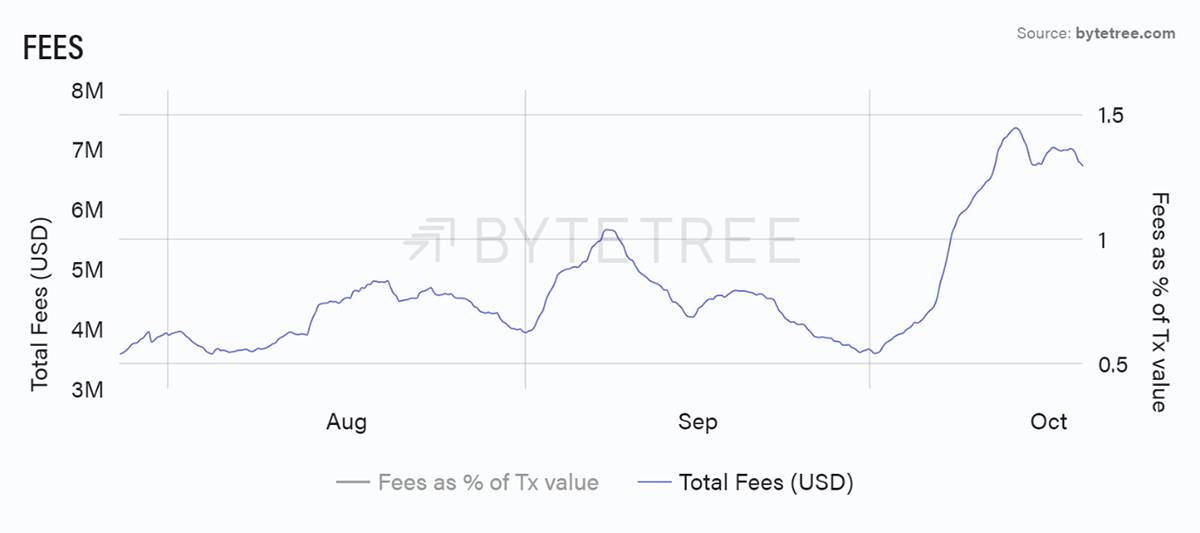
Source: ByteTree Terminal. Bitcoin Total Fees (USD) over the past 12 weeks.
Fees tend to rise quickly when transactions move above 2.1 million per week, or when the miners are slow to produce new blocks. The miners are back on target with average block times close to 600 seconds.
Let’s hope transactions keep on rising because that will help drive the bull market.
All in all, the on-chain data is improving, but it’s unquestionably following the price in this rally. It always feels more comfortable when it leads, but this never happens during the hype cycles.
Investment flows
The Bitcoin ETFs are coming to America. Unfortunately, they only invest in bitcoin futures as opposed to actual bitcoins. This is the regulator with a sense of humour. Having so far rejected the physical ETFs, they have approved these hopeless vehicles.
A futures contract settles at the spot price, but the further into the “future” you buy the contract, the more the price can differ from spot.
To get a sense of this, the “roll yield” is shown below. That is the price difference between the 2nd and 3rd monthly contract shown annualised. Currently, this is 8.8% (although it spiked to 17% this morning).
Futures underperform bitcoin
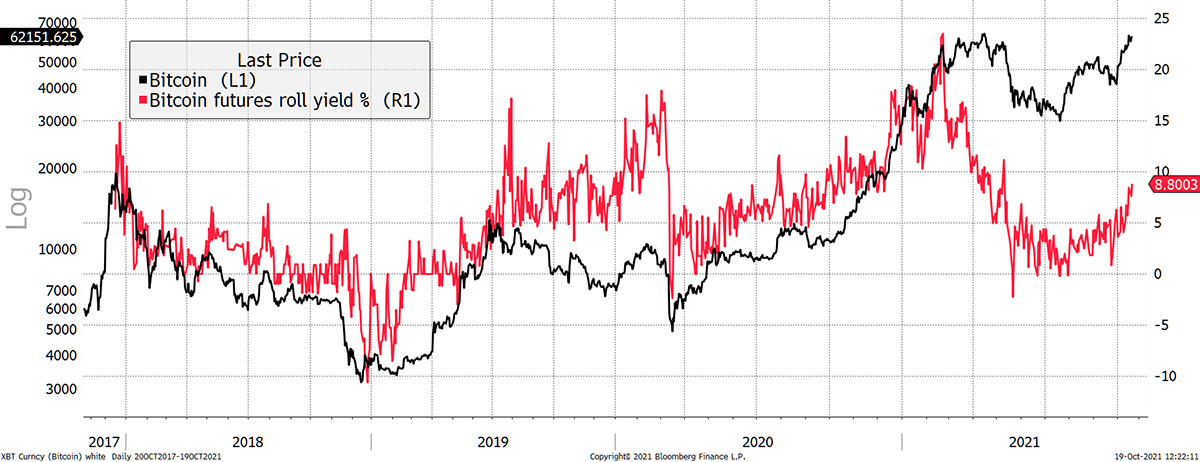
Source: Bloomberg. Bitcoin futures roll yield and bitcoin since 2017.
The roll yield has averaged 5.1% since the launch of the futures contract in 2017. Over the past year, it has averaged 8.4%. This is the amount an investor will underperform bitcoin each year. And don’t forget fees.
These products are dreadful, but many think they’ll be in huge demand from US investors. This seems unlikely, as NYDIG had a bitcoin futures mutual fund that they closed in June because they couldn’t raise capital.
How did it do? It underperformed the 21Shares Bitcoin ETF (ABTC SW) by 67% between Jan 2020 and June 2021. Yes, 67%!
But the roll yield is quite a good sentiment gauge for bitcoin as it reflects supply and demand. When the roll yield has been 15% or so, that has tended to coincide with market tops.
Occasionally it has turned negative, which has coincided with market bottoms. We’ll add this to the ByteTree build list.
Proper ETFs
In other news, flows into the proper bitcoin ETFs have improved, but it is a bit odd that so much has moved into BTCE when it is one of the most expensive funds out there, charging 2%. CoinShares Physical charges just 0.98%, so it’s strange that so much money wants to pay more than they need to.
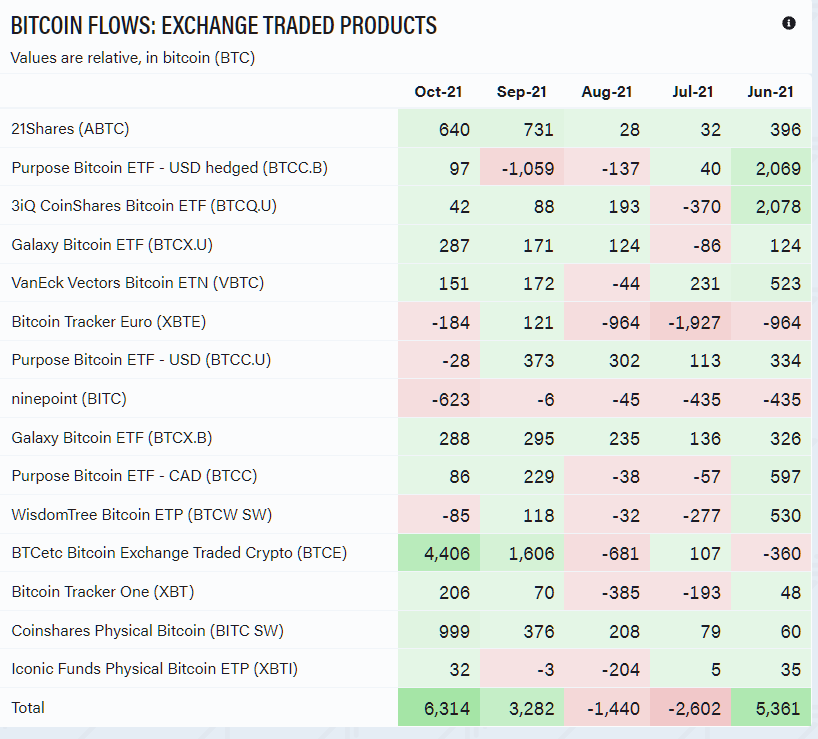
Source: ByteTree Terminal. Bitcoin Exchange Traded Products flows over the past five months.
Notice how the number of shares in issue has been very similar for 21Shares and CoinShares in terms of growth. BTCE has followed a very different path, which closely resembles price.
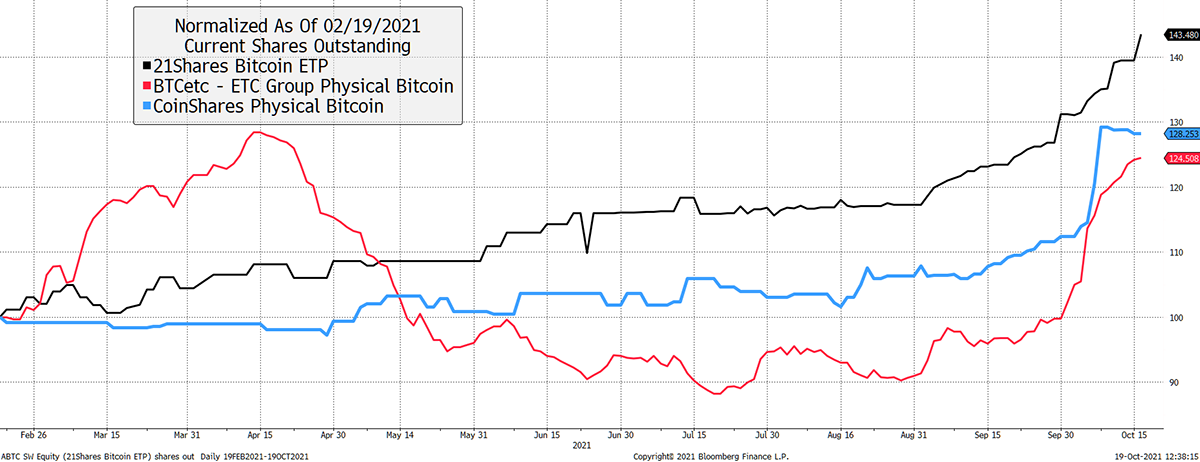
Source: Bloomberg. ABTC SW, BTCE GY and BITC SW shares outstanding rebased to 100 since Feb 2021.
BTCE clearly has a momentum player behind it, who adds to a rising price and sells when it falls. There is nothing to see here, perhaps, except that some say it’s fed by miners’ new bitcoins, as opposed to good old-fashioned cash. If so, you can assume they’ll dump at the next downtrend.
Apart from BTCE, ETF flows remain quiet.
Macro
The inflation narrative has been generous, and rightly so. All timeframes have been rising, and it seems likely that inflation is here to stay. Be prepared for this to remain elevated, but to level off. That’ll cool the narrative.
Bitcoin likes inflation
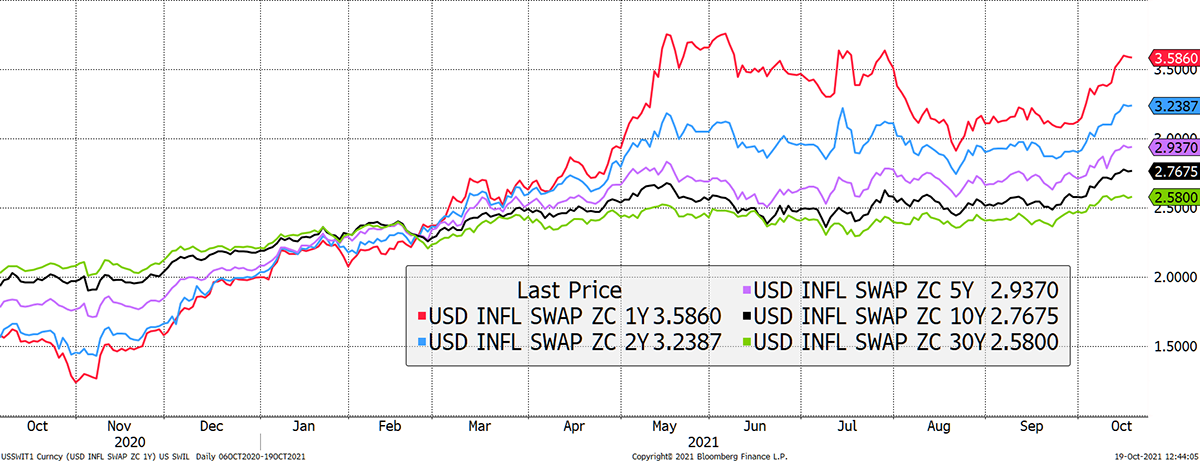
Source: Bloomberg. Bitcoin price and inflation swaps past year.
Above all, the rates regime is changing because the Fed will control the yield curve and prevent bond yields from rising too far. More on this next week, but inflation with capped yields favours gold over bitcoin. In theory at least.
Crypto
The alt rally has faltered. Over the past week, only Stacks (STX) has managed to nudge ahead of bitcoin. Our relative strength model has blasted out lists of alts making new 30-day relative lows.
This can be visualised by the MVDA25 crypto index. There was a high in May showing peak alts. The recent high has been lower, and now alts are underperforming bitcoin.
Alts lag bitcoin
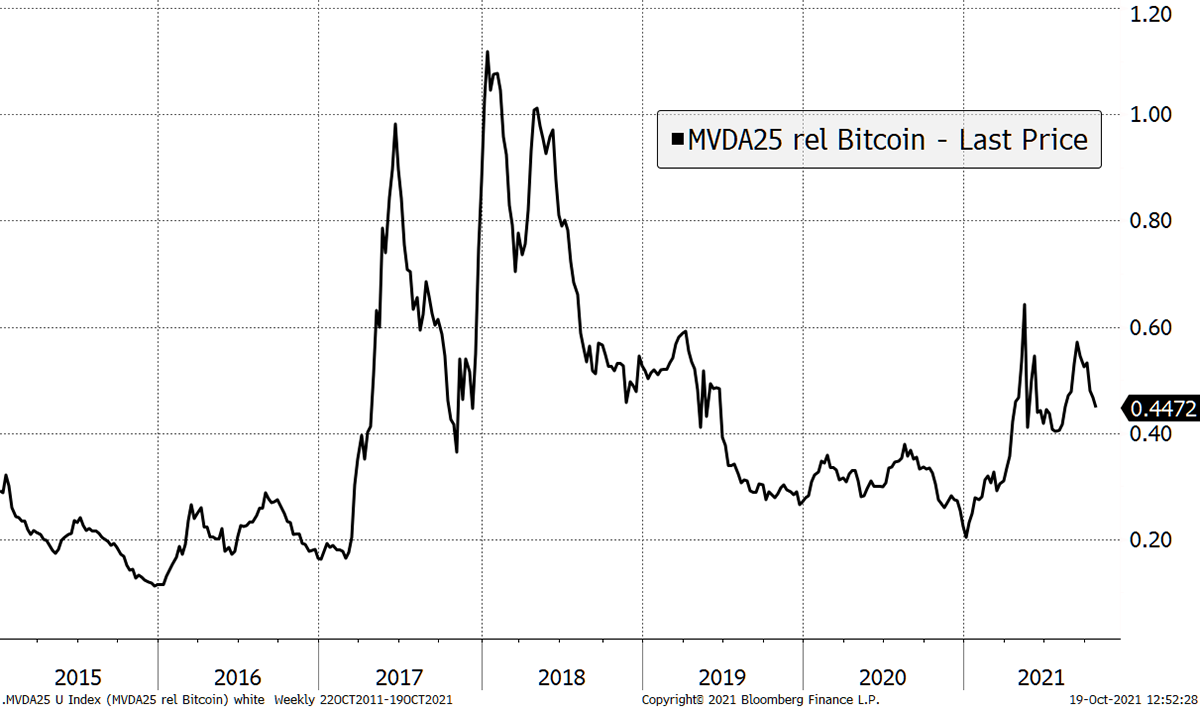
Source: Bloomberg. MVDA 25 Index relative top bitcoin since 2015.
Alts surged in 2017 before three years of pain. All of their bull market excess return was given back. Will history repeat itself?
This could just be a shakeout, but one of the main sources of recent bitcoin strength has been investors switching out of alts and into bitcoin.
Summary
There is a sense that October’s strength has been a frenzy around the ETF launch. These products are so bad, and in any event, the bitcoin futures market isn’t big enough to carry many assets anyway. If NYDIG canned their project, those about to buy futures ETFs should take note.
There’s also been the inflation narrative, which we’ll cover in more detail too. There’s a story to tell about what happened in late 1972 - financial markets are starting to look a bit like that. We’ll then find out whether bitcoin is more like gold or equities. There’s no middle ground

