

ATOMIC 21
The Institutional Dominance Ratio (IDR) is riding high. We’re really pleased by how useful this indicator has turned out to be. It simply measures the highest quintile of block transactions as a percentage of all transactions.

Highlights
| Technicals | Strong, need to confirm the all-time high |
| On-chain | Strongest since May |
| Macro | Regime change favours gold |
| Investment Flows | Institutional Dominance Ratio (IDR) shows increased activity |
| Crypto | Reader feedback |
ByteTree ATOMIC
The all-time high seen last week as the bitcoin futures ETF launched only lasted for a day. The precedent here is March 2017. The price made a new all-time high, breaking $1,200 after a 3.5 year wait. It broke, pulled back, and then went nuts.
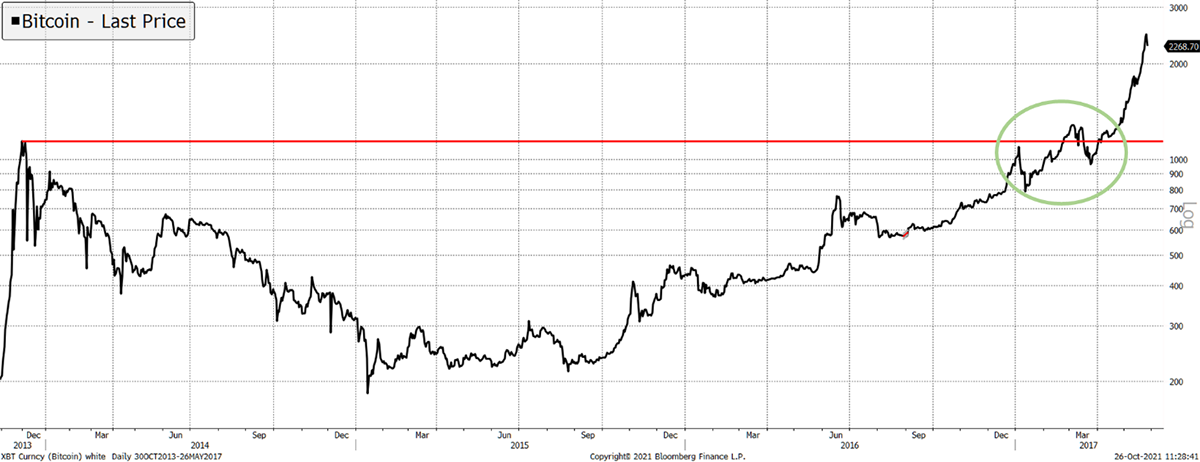
Source: Bloomberg. Bitcoin 2013 all-time high $1,200 and the 2017 first attempt.
It could happen, but then there’s the other possibility. The Bitcoin futures contract launched on 18 December 2017, which marked the cycle top. Surely the futures market can’t mark two tops? With the SEC on the side with futures, the conspiracy theories will never go away!
Technical
We’ll now start coverage of ETH alongside BTC in ATOMIC. This will start light but improve over time. That takes ETH out of Token Takeaway and onto these pages.
Short-term, the 30- and 200-day moving averages are positively sloping, and the price is above both. The price has been steadily making new 20-day highs in October. The ByteTrend score is 5/5.
BTC trend remains strong
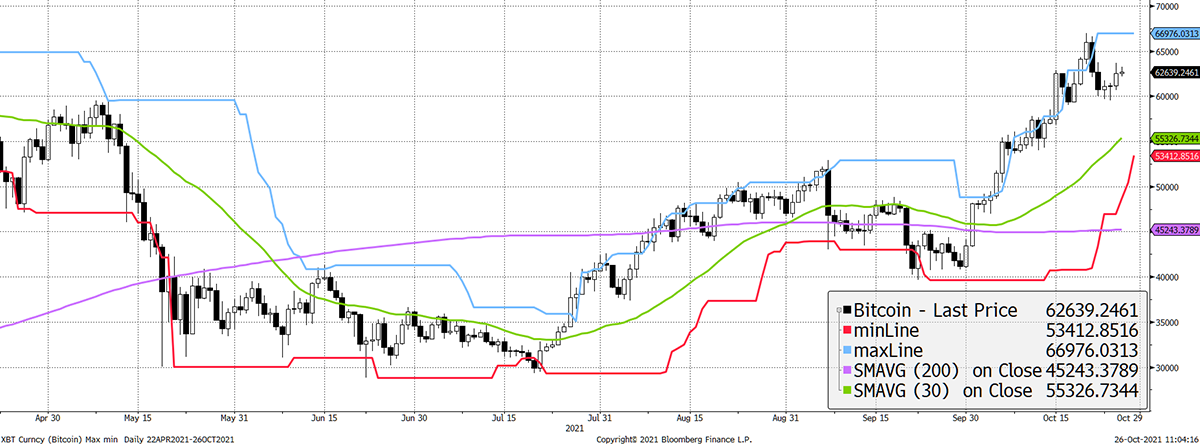
Source: Bloomberg. Bitcoin with 20-day max and min lines, 30-day and 200-day moving averages past six months.
ETH scores 5 with a stronger 200-day ma
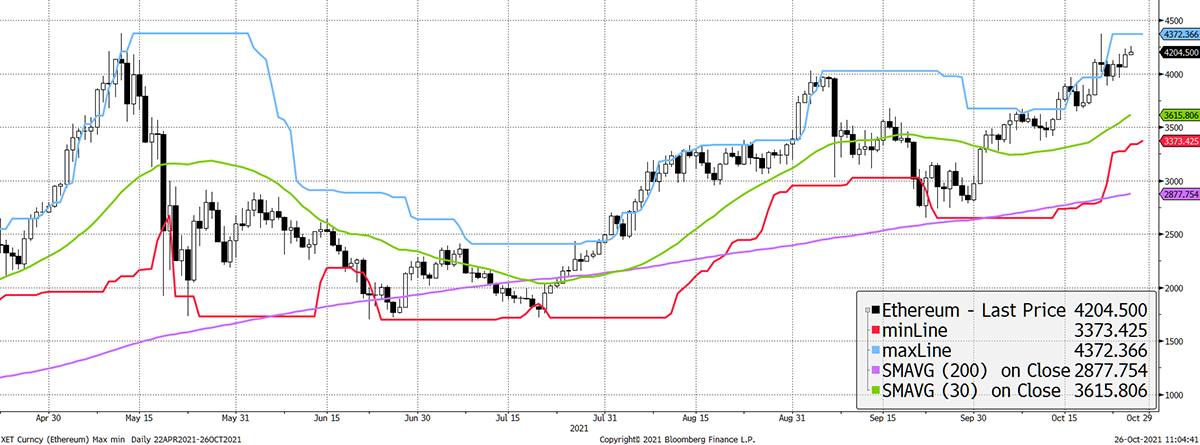
Source: Bloomberg. Ethereum with 20-day max and min lines, 30-day and 200-day moving averages past six months.
The trend relative to bitcoin, using ByteTrend, is strong. ETH has a convincing 200-day relative moving average, and a small jump to the upside will put this chart on a 5 as well (currently at 3/5 as its last touch was min and the 30-day ma is negatively sloping).
ETH remains in a strong relative trend
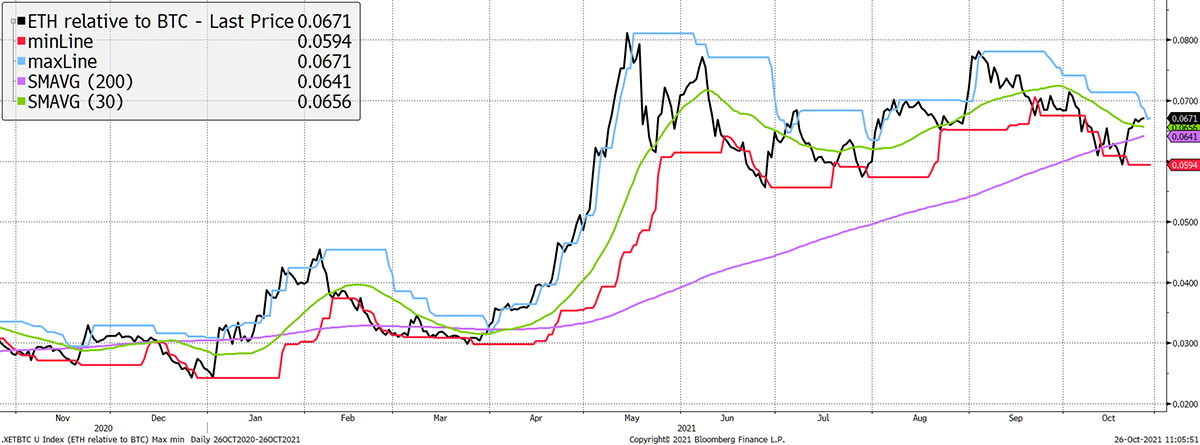
Source: Bloomberg. ETH in BTC with 20-day max and min lines, 30-day and 200-day moving averages past six months.
ByteTrend explained:
We urge you to become familiar with the ByteTrend score concept because it will become a major feature in ByteTree technical research. Quite simply, it enables a trend to be quantified, which helps to remove emotion and provide a comparison across many charts for cross-market screening.
A ByteTrend score gets a point for each of the following criteria:
- Price is above the 200-day moving average
- Price is above the 30-day moving average
- 200-day moving average slope is rising
- 30-day moving average slope is rising
- The last touch of the max/min lines was blue
On-Chain
In 2021, the on-chain activity has responded to price. We’ve seen this before, but last year, and generally speaking, it has been the other way around. In any event, $60bn of weekly transfer value is positive.
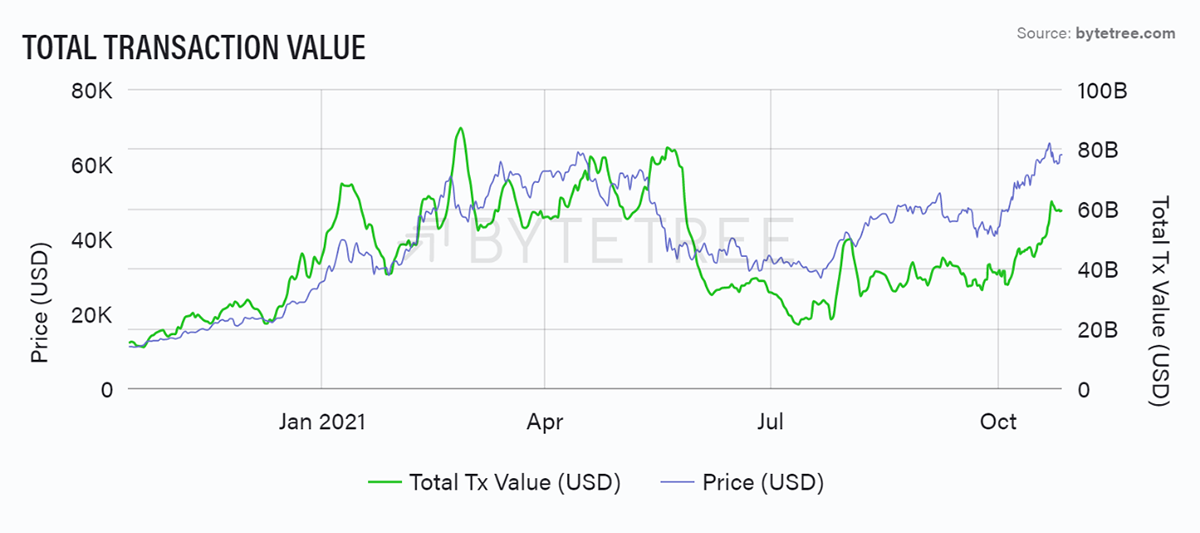
Source: ByteTree Terminal. Total transaction value (USD) and the price of bitcoin (USD) over the past year.
Fees have been more perplexing. Never before have we seen such high prices coincide with such low fees.
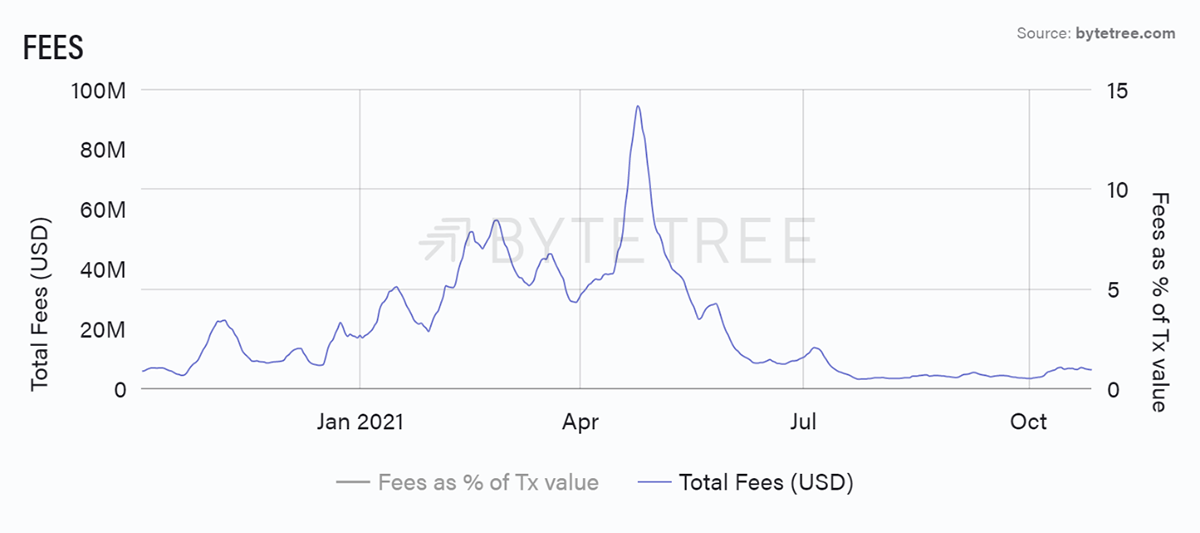
Source: ByteTree Terminal. Total bitcoin fees (USD) over the past year.
One thing to consider is that transaction levels, although recovering, remain low. That coincides with a highly competitive mining environment, or in other words, a surplus of blocks. A new block is coming through, on average, every 550 seconds, 50 seconds below target.
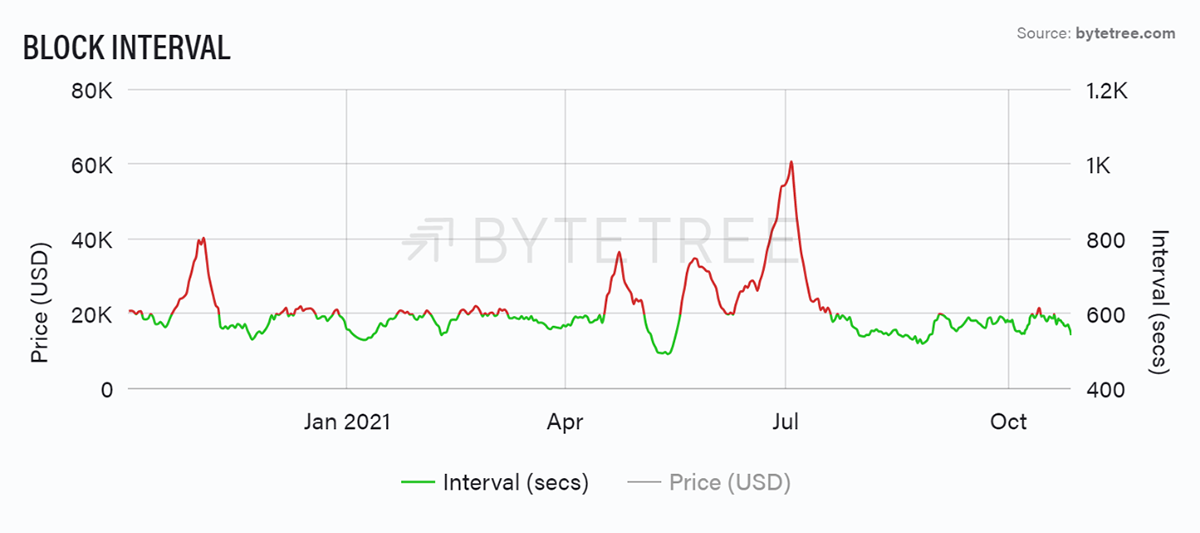
Source: ByteTree Terminal. Bitcoin block interval (secs) over the past year.
When the miners were running slowly - from May through to July and late last year - fees jumped as there was a lack of blocks to process transactions, resulting in high fees. We now face the opposite situation. Perhaps it’s not bearish at all and merely reflects the mining shift from China to the USA.
Expect another 10% upward difficulty revision on Sunday, 31 October. Mining margins will start to come under pressure.
Investment Flows
IDR is riding high. We’re really pleased by how useful this indicator has turned out to be. It simply measures the highest quintile of block transactions as a percentage of all transactions.
A high reading means the institutional investors, with high-value transactions, are active and vice versa. It seems a reading above 99% basically says all is well and stay long. That signal lagged in the May selloff, but that was an event as opposed to a natural cooling. Later in July, IDR was highly effective. Right now, the institutions can’t get enough.
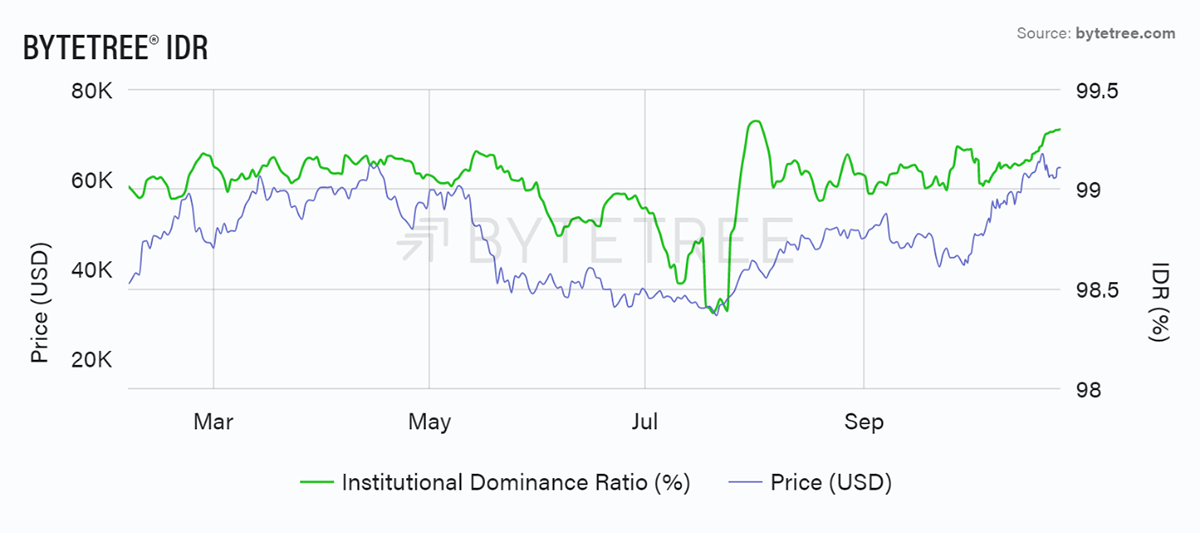
Source: ByteTree Terminal. The Institutional Dominance Ratio (IDR) and the price of bitcoin (USD) since April 2021.
The other indicator that is adding value is the flows. The ProShares futures ETF (BITO) raised $1.2bn, which has seen a 30-day BTC deficit re-emerge. There’s also the Valkyrie futures ETF (BTF) with $51m. It pays to launch first!
Given these inflows, the miners aren’t selling enough to meet demand. If this holds, then the bull market is underpinned. Flows are super important as they underpin everything. Those miners need to be paid in real money.
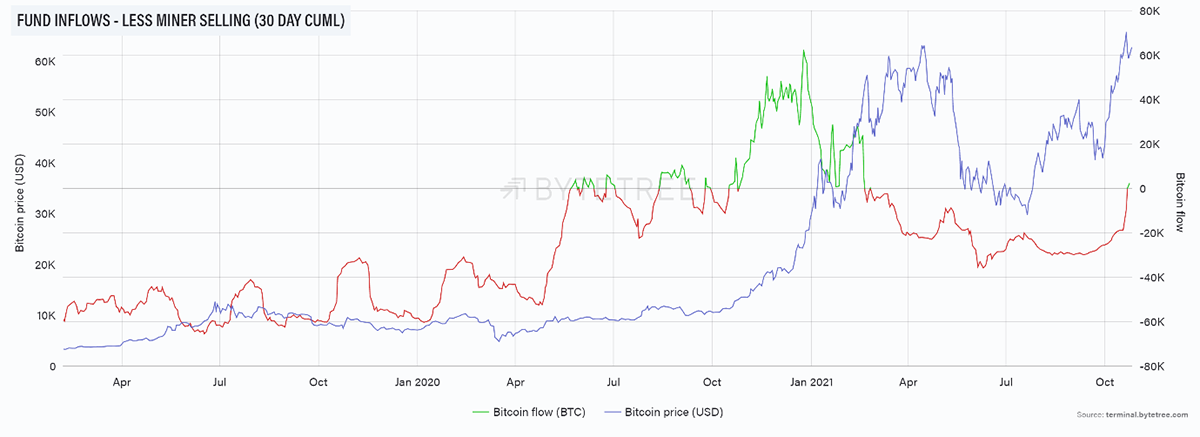
Source: ByteTree Terminal. Bitcoin fund inflows (BTC), 30-day cumulative less miner selling, and the price of bitcoin (USD), since February 2019.
In Ethereum, we can’t yet show the supply, but demand is pretty effective. There are still positive fund inflows, which have been supportive. That said, they have been cooling relative to BTC.
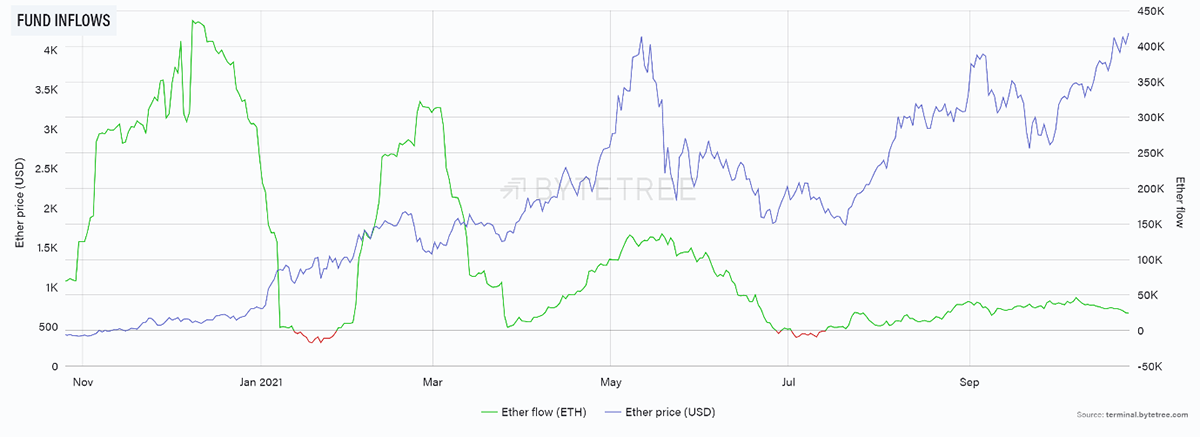
Source: ByteTree Terminal. Ethereum fund inflows (ETH) and the price of ethereum (USD), over the past year.
Macro
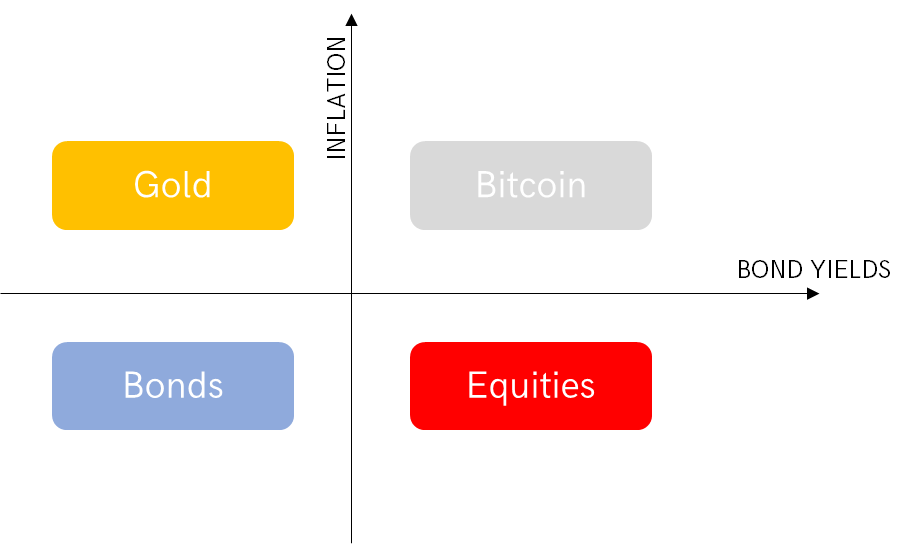
The Money Map is a concept that helps to frame the macro environment. BTC and crypto do best when the bond yield is rising (risk-on) along with inflation. Gold prefers it when inflation is rising, yet the bond yield holds back - so that real interest rates are falling. When inflation falls, neither gold nor BTC are in the sweet spot, and the old world outperforms.
Looking at the bond market for guidance, both yields (blue) and inflation (red) have been rising, yet, the former at a faster rate. That has put downward pressure on real rates (cyan), which have started to fall again.
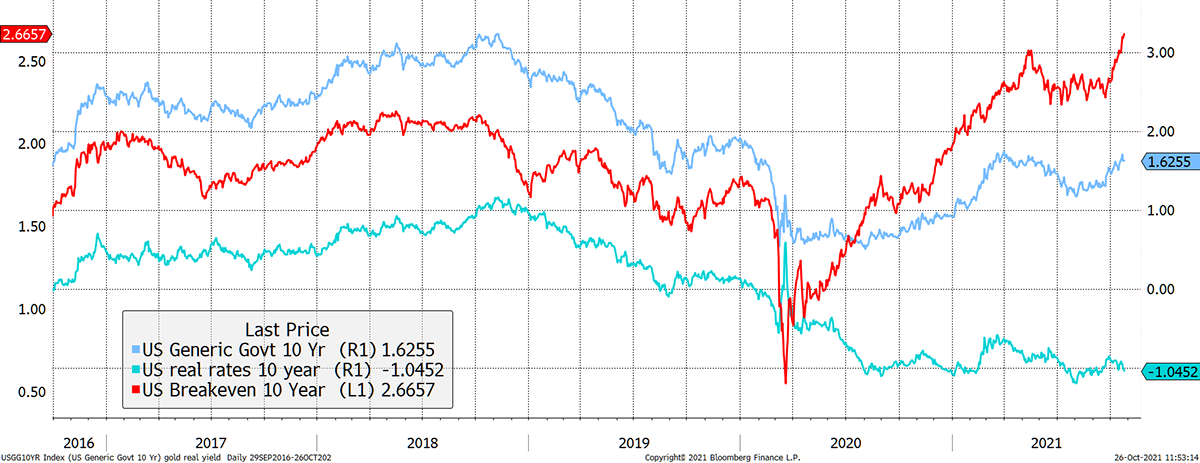
Source: Bloomberg. US 10-year yield, 10 year breakeven (inflation expectations) and real rates (rates less inflation) since 2016.
Recall how in early 2020, when real rates were falling, gold beat BTC. The situation reversed when real rates hit -1%. Gold is not dead; it is just resting. There will be more coverage on this subject in the coming weeks.
Crypto
An ATOMIC reader got in touch, @mustachedcrypt0, and made some good points. Our apologies for the late reply. He wrote:
It seems to me the narrative around BTC has changed from digital payment system to digital gold, i.e. safe-haven asset you hodl. In light of that changed narrative, one would expect the network transactions to slow as more people hodl and fewer sell.
Gold trades $1,250bn per day, according to the World Gold Council. I would say that digital gold needs much more liquidity, not less. Liquidity, through good times and bad, has value. That’s why people receive less return for US treasuries versus other high-quality debt (hyperinflation, I know, but not relevant in this context). Investors are happy to give up return for the assurance of liquidity. If bitcoin wants to become gold, it needs to massively increase liquidity from here.
In its place, ETH and other L1s seem to be where the actual transactions are occurring. So network activity *there* seems more important to the price of BTC, and crypto overall, since the crypto sector is an asset class that is still highly correlated.
I believe all valuable cryptos will need to have vibrant networks unless they represent other assets such as land or have an equity value linked to something crypto.
What we really want to measure is overall interest in the crypto asset class - more eyeballs and more demand there will settle out through the ecosystem. It might not *always* correlate to BTC price, but it often will, as folks rotate in and out of BTC.
Google search and so on will pick that up, but that’s mainly retail activity. On-chain measures the money as opposed to the cheers on Twitter. BTC is a money machine. It is fed by money, and without it, I’m unconvinced it can appreciate on a sustainable basis.
If this is true, we should be more interested in network demand of ETH/L1’s. As that decreases, it signals waning interest in cryptocurrency, which will result in price adjustments throughout the space.
If true, I agree. ETH network demand and BTC are highly correlated. My view is that BTC is the “beta” in crypto and the alts provide an opportunity for alpha (or not). This is like saying BTC is the market, and the alts are jockeying for pole position.
I’m not sure what we want to measure in its place for BTC. Maybe the hodl patterns of major wallets? Look for selling versus buying of smart money?
HODL is curious. If a coin was dead, every coin would be HODLed. An alive coin would see increasing distribution. I believe there’s a balance. Some HODL is needed to tighten the market, but if there’s too much, liquidity suffers. You might get a high price for a while, but ultimately there will be poor market depth, which will mean a large seller will have undue influence.
Of course, this could all be wrong. The network demand model might be right, and results are simply lagging. Or this is an exit pump, or whatever.
It could be right or wrong. The curious thing is how such low fees are supporting such a high price. We have never seen this before. In any event, it is definitely lagging this cycle.
But there are so many changing narratives and use cases in crypto, I wouldn’t be surprised if this has an effect on past models. My thesis on memecoins, for example, is that NFTs have basically taken over there. Not fully - much easier to buy/sell doge. But speculation is moving.
Memes are great fun, but a good old-fashioned crisis will come about at some point and will see them go back to where they came from. But the wider experiment is fascinating. The innovation around crypto is first class. We are trying to understand what will stick and what will fade.
Anyways, figured I’d put it out there for your consideration. I appreciate ByteTree premium, and especially the close look at the transaction data y’all are doing. Just wonder whether some of the underlying assumptions of NDM are still accurate.
We question everything, and things move quickly. There is no magic bullet, and we do our best to understand this space and share what we know with our clients. Thank you for the feedback and our apologies for the delayed response.
Summary
Many of the post-May risks have been put to rest. The regulatory situation is clearer, and the miners are back. That’s a plus, but we do wonder about the futures ETFs. They are terrible asset gathering vehicles.
And it would be optimistic to assume they will raise as much capital as it is widely believed. Real ETFs might, but not these imposters.

