

ATOMIC 18
As Facebook goes offline, Bitcoin doesn’t. We are living in the biggest asset bubble, probably of all time, and in recent days, bitcoin has defied gravity. Has monetary status finally arrived, or is the space just hooked on bad data?
Highlights
| Technicals | BTC bounces back |
| On-chain | Network is asleep despite mainstream fake data |
| Macro | Bitcoin breaks tech |
| Investment Flows | ETFs stable, GBTC discount |
| Crypto | Circle and the regulator |
ByteTree ATOMIC
“The worst job I ever had” was a famous comedy sketch by Derek and Clive. He had to remove lobsters from Jayne Mansfield’s bum. We can only assume Peter Cook and Dudley Moore had never been crypto analysts.
Volatility refuses to go away, and bitcoin has flipped upwards once again despite weak data around it. One major problem is that the crypto space is trading on the back of bad data, which shows a roaring network. If only it were true.
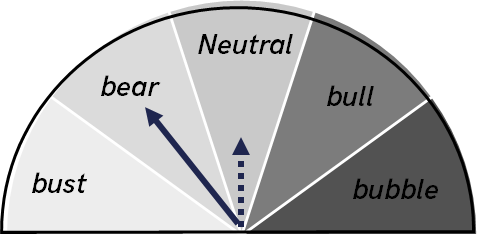
ATOMIC holds the bear call despite the strong price action, and we’ll explain why. A bear is a high conviction call that materially lower prices are likely, just as a bull implies much higher prices. Bitcoin has just fought off the jaws of the bear for the second time, and this data issue cannot be ignored.
Technical
The trendlines for this cycle are becoming clear. The red line links the major lows since 2018 and rises at a rate of 48% IRR. The blue line catches the March 2020 low, the pre-breakout in September 2020 and the recent low at $30k. It rises at 283% IRR. That is an extremely high number to sustain for a near trillion-dollar asset. The green line links the highs post-April 2021 and falls at -39% IRR.
A wedge has formed, with the green and blue lines converging in December at $47,500.
The bitcoin wedge
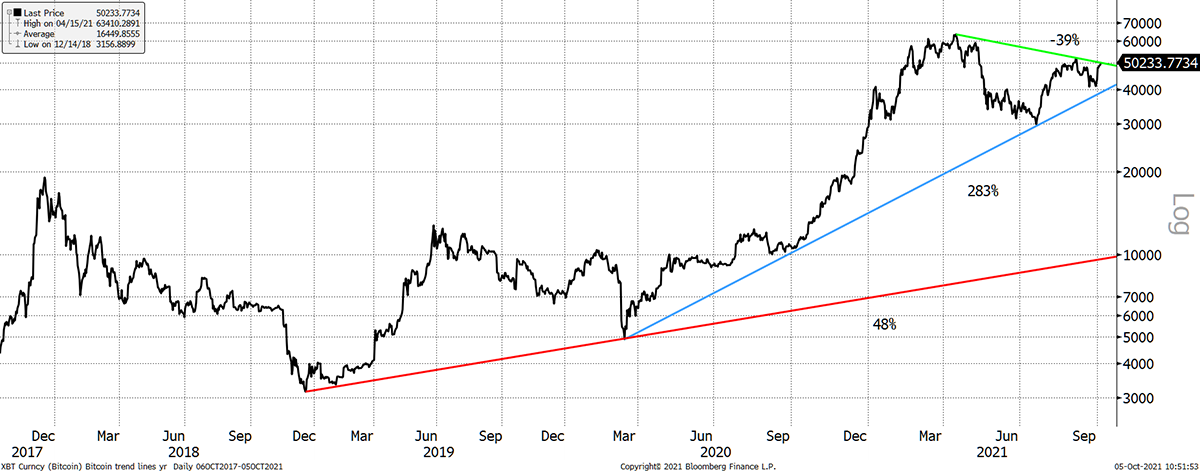
Source: Bloomberg. Bitcoin log scale with trendlines since 2017.
The price could break higher or lower, but in any event, this wedge ends in two months.
Short-term, the 30- and 200-day moving averages still have a negative slope, but the price is back above both. Should the price hold at $50k, both moving averages will be positive within days. On the max/min lines, the last intraday touch was blue. BTC has a ByteTrend score of three.
This level of choppiness is unusual.
Bitcoin trend
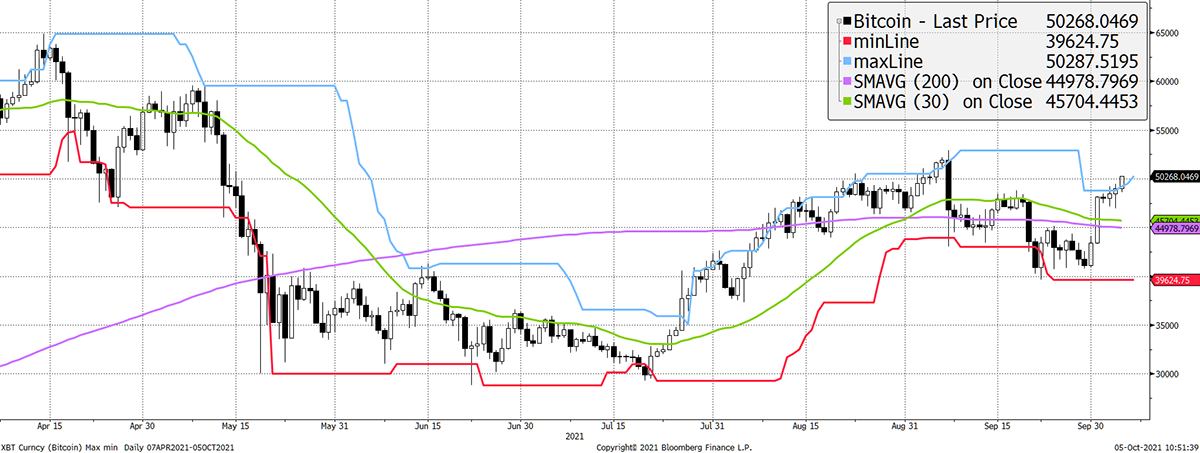
Source: Bloomberg. Bitcoin with 20-day max and min lines, 30-day and 200-day moving averages over the past six months.
ByteTrend explained:
We urge you to become familiar with the ByteTrend score concept because it will become a major feature in ByteTree technical research. Quite simply, it enables a trend to be quantified, which helps to remove emotion and provide a comparison across many charts for cross-market screening.
A ByteTrend score gets a point for each of the following criteria:
- Price is above the 200-day moving average
- Price is above the 30-day moving average
- 200-day moving average slope is rising
- 30-day moving average slope is rising
- The last touch of the max/min lines was blue
The trend turned just as the price moved back above $45k, so the technical case will deteriorate should it move back below. We’re getting dizzy.
Breadth has also improved, with over 50% of the top 100 coins back above their 30-day moving averages.
Crypto breadth
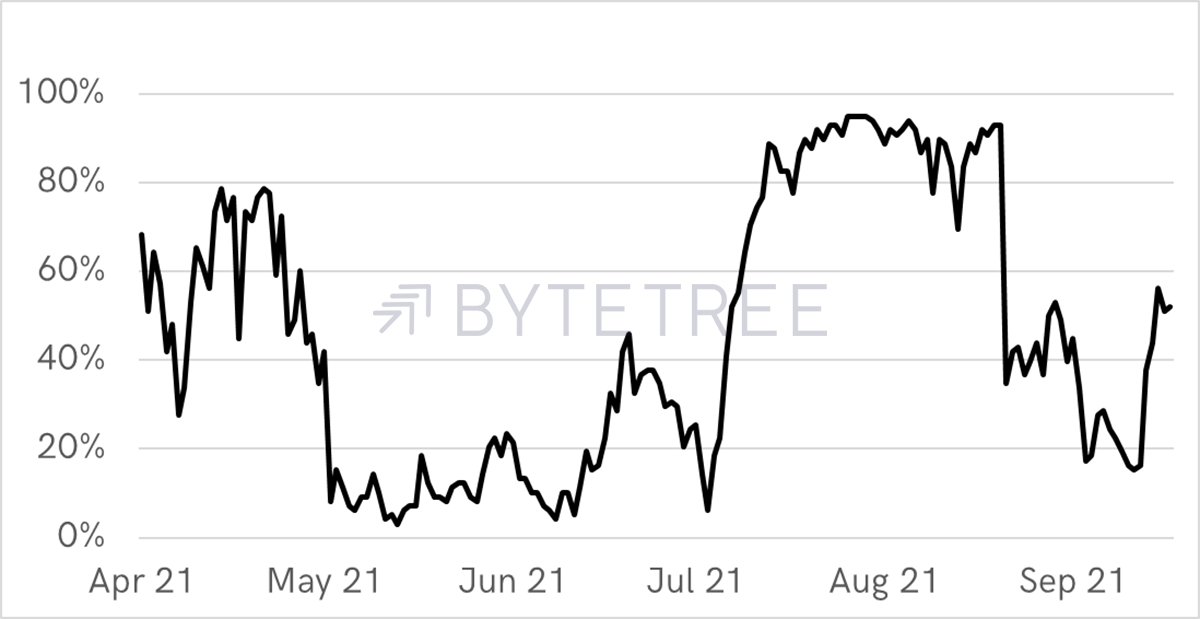
Source: ByteTree. The percentage of top 100 coins trading above their 30-day moving average since April 2021.
Volatility is one thing, but the chop in trend is hard to bear. The technicals have strengthened, and a new bull is possible, but 283% is one hell of an IRR to sustain for any period. There are many positive narratives, but there are also risks.
On-Chain
Fake data is potentially the greatest risk. Many investors believe bitcoin’s blockchain is transferring more value than ever before, and by multiples. At ByteTree, we believe this data is false.
Calculating transaction value is highly complex as the blocks don’t give you a straight answer. You have to calculate it by analysing each transaction, of which there have been 675 million to date. When you send BTC, you receive change, even though you don’t notice it happening. If you had 100 BTC and sent 10 BTC, some calculations will see this recorded as 190 BTC, rather than 10 BTC, which we do at ByteTree.
Comparing four data providers, you’ll see that ByteTree has similar data to Blockchain.com. The weekly transaction value is $27bn and $25bn for Blockchain.com and ByteTree respectively. Those readings are roughly half the level seen during the April boom.
CoinMetrics register $139bn, and Glassnode a whopping $341bn. These are both higher than the readings in April. Given these are the most popular data sources, the market widely believes transaction value is at an all-time high. It isn’t.
Network data varies wildly
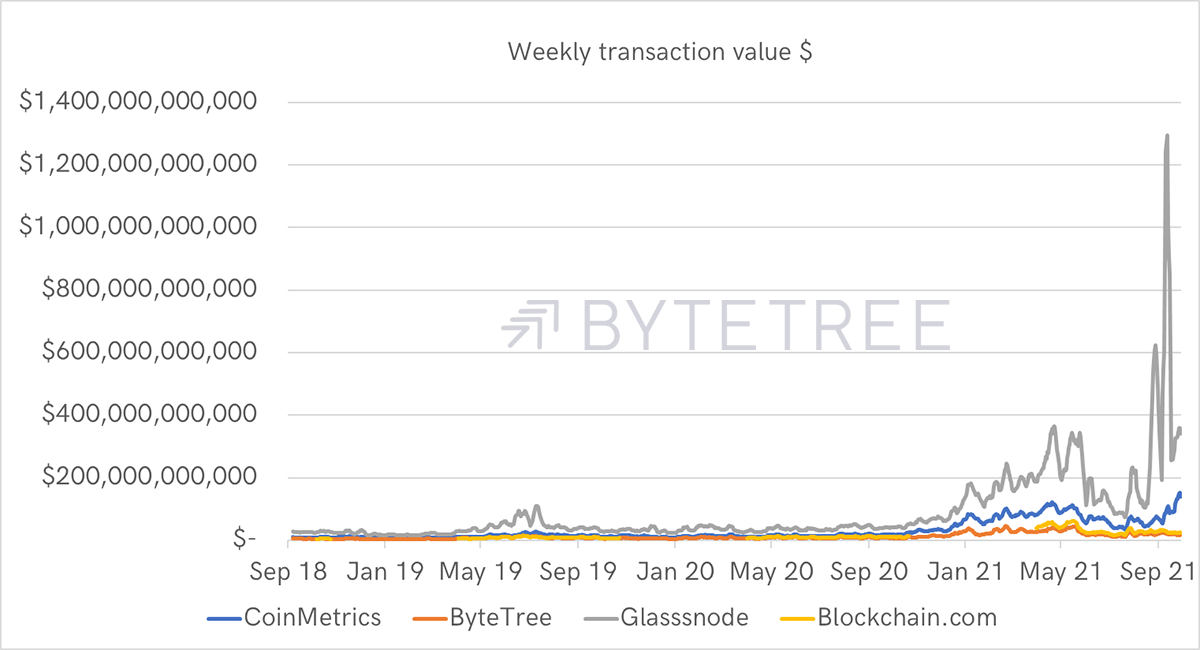
Source: ByteTree; Blockchain.com; Glassnode; and CoinMetrics. Transaction value since 2018.
On a log scale, the differences become clearer. Since April, a gap has opened up. Previously, the data was correlated, even if the levels varied. Frankly, that’s the bit that matters most. It is the post-April divergence that tells a completely different story.
Blockchain.com and ByteTree see the network at half the size of April, whereas Glassnode and CoinMetrics see it much larger.
Data divergence
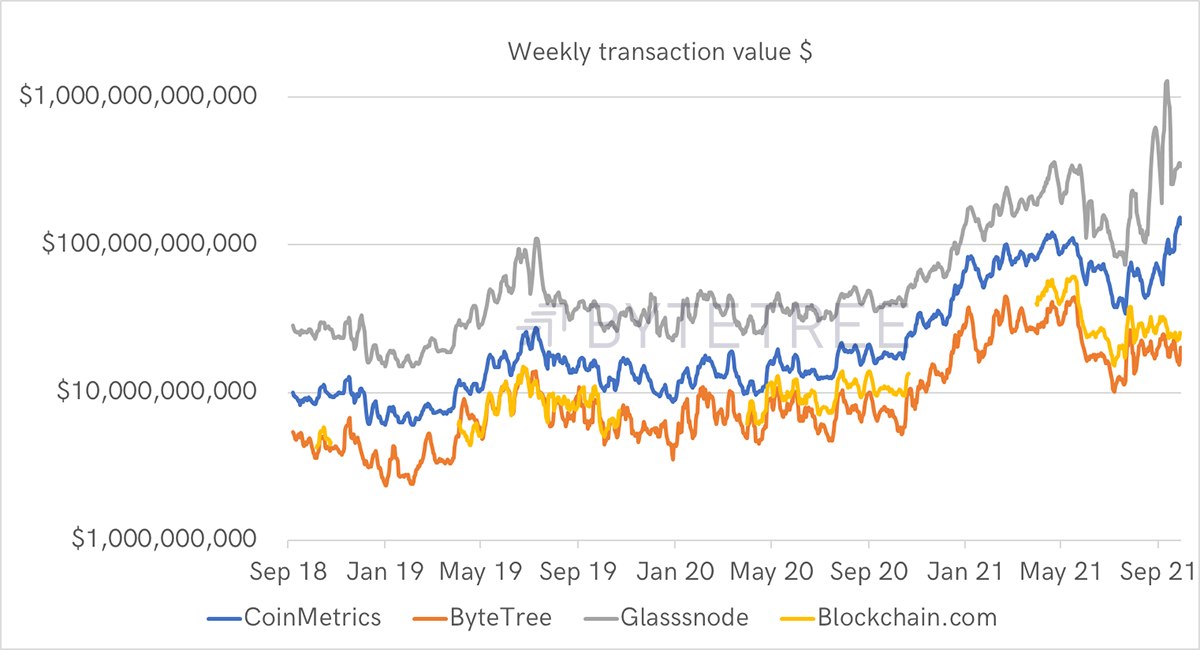
Source: ByteTree; Blockchain.com; Glassnode; and CoinMetrics. Transaction value since 2018 log scale.
ByteTree spotted this problem in August 2020. Just as we were punching the air about how the blockchain was exploding, it didn’t make sense as it wasn’t being confirmed by other factors such as increased transactions and fees. It was too good to be true.
We recognised that CoinJoin and Batched transactions were interfering with the transaction value calculation. They were being looped and continuously recounted.
ByteTree Legacy data
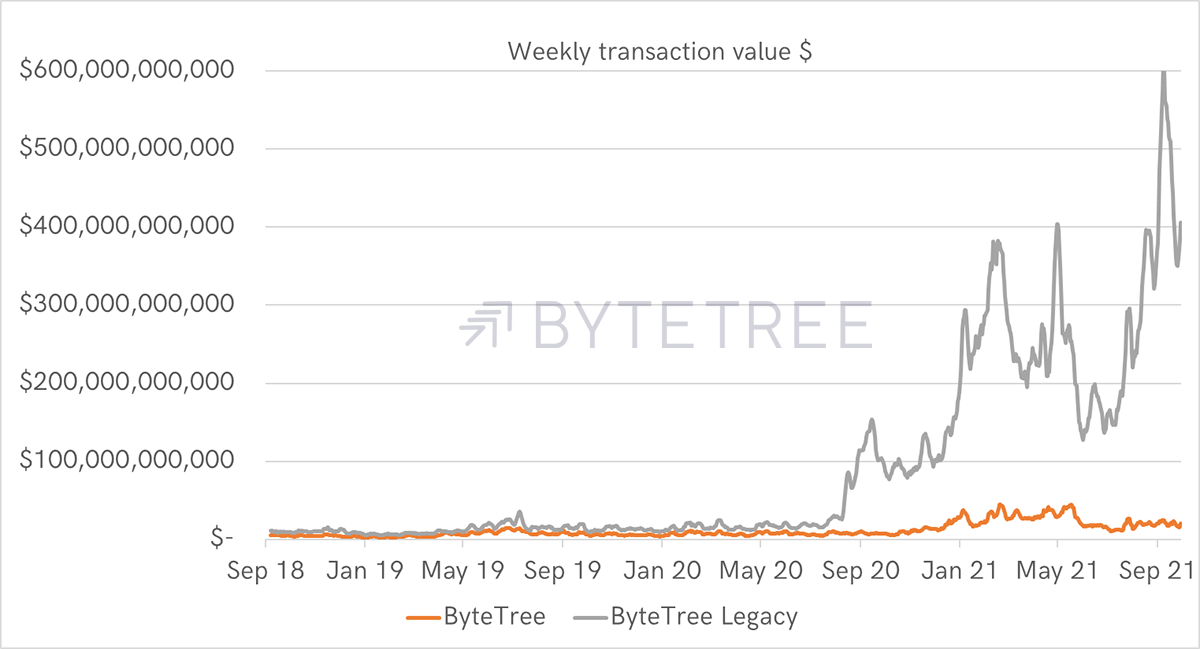
Source: ByteTree. Current transaction value and the legacy method since 2018.
It turns out that ByteTree Legacy data has much in common with Glassnode data today, and we suspect there is an element of this problem in the CoinMetrics data.
ByteTree changed its methodology, and we believe it is the most accurate measure that is publicly available. If legacy was still being used without knowing better, we’d be as bullish as Plan B.
Who’s right?
A simple test as to whether transaction value is at an all-time high or half last April’s levels comes from confirmation signals from transactions and fees. These are undisputed blockchain outputs across all data providers. They remain depressed, which doesn’t support the vibrant activity narrative.
If our competitors were right, the current rally would make total sense as bitcoin adoption would be booming. We believe they are wrong. This is the most important question in bitcoin analysis.
Investment Flows
The Grayscale Bitcoin Trust (GBTC) saw a modest discount tightening yesterday from 18% mid last week to 13% on Monday’s close. Wall Street has noticed the rally, which is positive.
ETH flows remain strong, while BTC flows are mildly positive.
Macro
Inflation expectations are surging in Europe yet remain stubborn in the US. The conclusions must be that the energy crisis is a greater issue on the east side of the Atlantic than on the west.
Bitcoin has responded well to rising inflation expectations in the past, which fits with the hard asset narrative. The jury’s out on the impact of an energy price surge, but still, it is hard to imagine inflation not being a supportive force, as the evidence suggests.
Bitcoin likes inflation
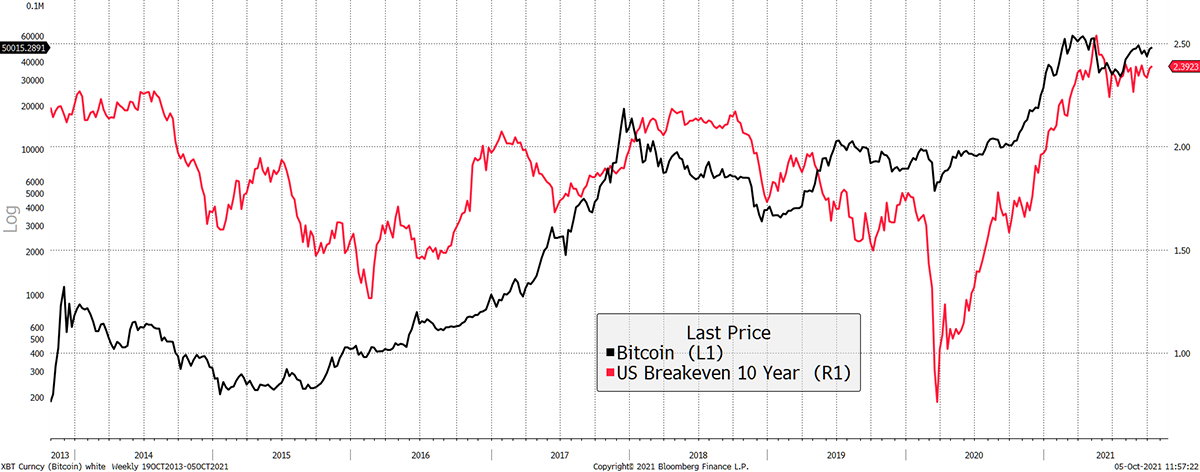
Source: Bloomberg. Bitcoin price and US 10-year inflation expectations since 2013.
Of more concern is the tech wreck evolving in the old world. After a fabulous decade, tech stocks are coming under pressure. Historically, the link between bitcoin and internet stocks have been strong.
Internet stocks feeling the pain
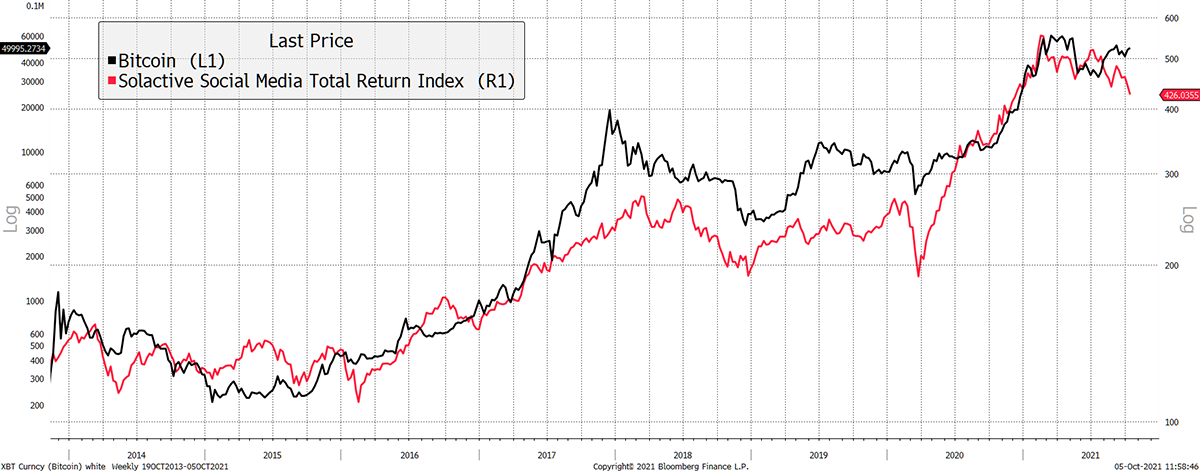
Source: Bloomberg. Bitcoin price and social media stocks since 2013.
The great bull case for bitcoin is that it becomes a monetary asset. As Facebook goes offline, bitcoin doesn’t. It’s a win for decentralised networks.
We are living in the biggest asset bubble, probably of all time, and in recent days, bitcoin has defied gravity. Has monetary status finally arrived as investors flee traditional assets and seek safety in bitcoin?
Bitcoin fights off NASDAQ
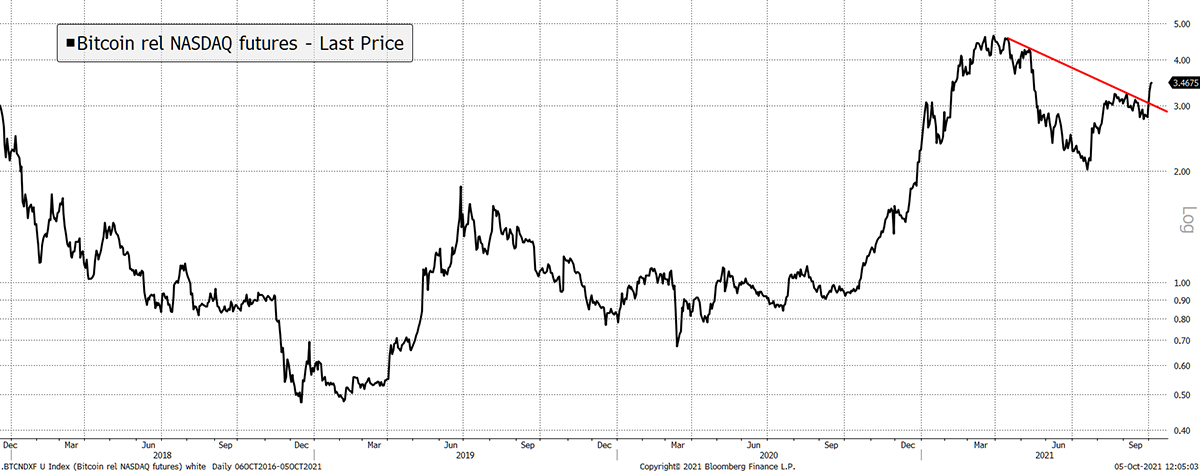
Source: Bloomberg. Bitcoin futures relative to NASDAQ futures since 2017.
It’s a big question.
One of the big differences between this cycle and past cycles has been the success of the stablecoin. For the first time, crypto has its own cash, which has meant the banks haven’t been able to interfere. Stablecoins have had a positive impact and are the area the regulators won’t leave alone.
Crypto
Stablecoins have yet again come under fire, with Circle getting “served” by the U.S. Securities and Exchange (SEC) in July 2021, although the filing was registered on 4th October. This subpoena requested “documents and information regarding certain of our holdings, customer programs, and operations”. Previously, Circle has disclosed a $10m payment to the SEC for their dealings with the unregistered exchange Poloniex; meaning, Circle is not as much an angel as many believe.
This event signals yet another issue from the stablecoin world. Tether, which is the largest stablecoin by market cap, has come under fire many times (enter FUD). While many thought Tether was the dodgy crypto, it seems that The Circle Group have problems of their own. Does this mean the combined $100bn of USDC and USDT flowing around the digital asset space have a high probability of being dodgy cash?
The catalyst for this regulatory intervention seems to be the planned merger between Circle and purpose acquisition company Concord Acquisition Corp. Also, the launch of Circle Yield last month must have sparked the attention of the SEC again. Naturally, stablecoins are the sector where regulatory issues will occur. Therefore it should come as no surprise when events like this occur. Where dollars are exchanged, the SEC will investigate.
To demonstrate how USDC issuance interacts with the bitcoin price, here are two more charts. USDC issuance has enjoyed strong growth, which is bullish for crypto as it now has alternative financing away from banks.
Notice the surge in issuance in May when the bitcoin price fell. That means investors sold for USDC, and USDC supply rose. Then in August, as confidence was restored, issuance of USDC dried up as they bought back bitcoin. These are still early days but expect stablecoin issuance to become an increasingly useful indicator.
USDC Issuance and bitcoin
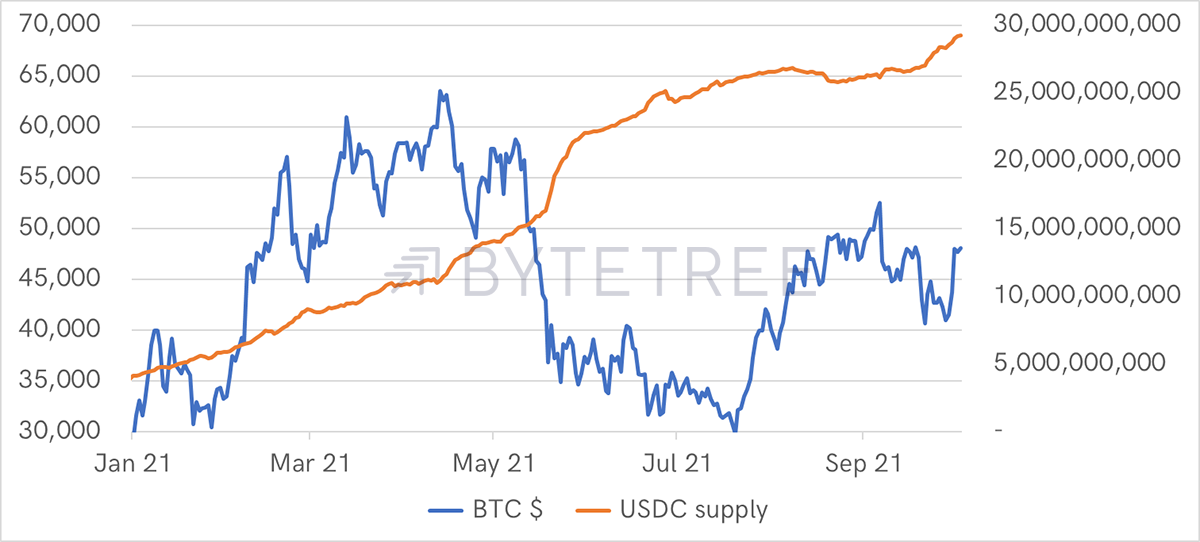
Source: ByteTree. USDC supply $ with bitcoin price ($) 2021 year to date.
That becomes even clearer when you look at the change in issuance. The correlation between February and May was high. The decline in issuance in July told us the selling pressure had eased, which helps explain the August rally. At least, it tells us that the selling pressure had eased.
USDC change in Issuance Inverted and bitcoin
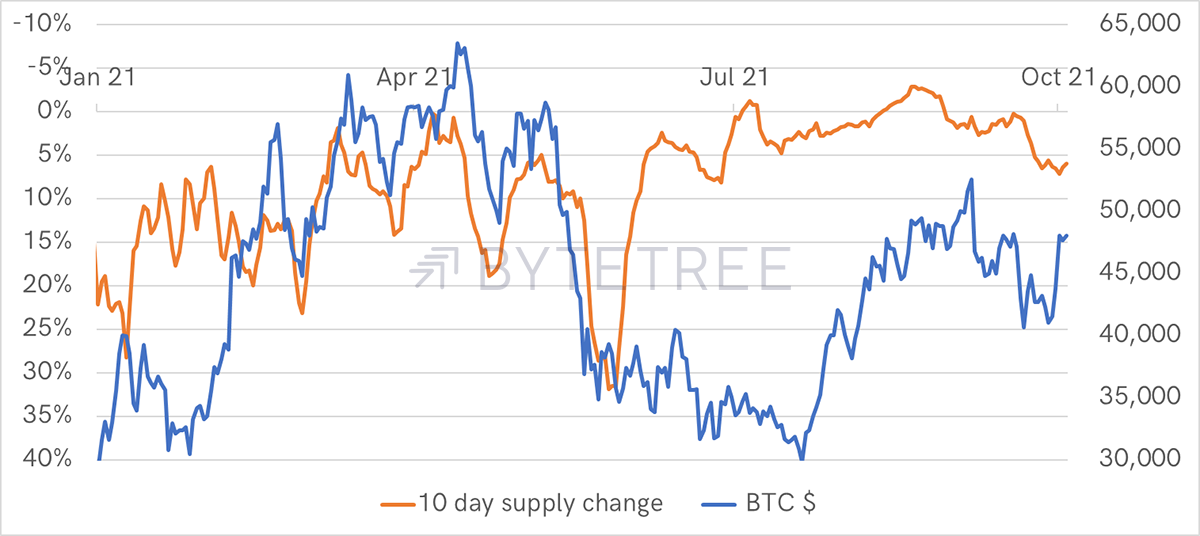
Source: ByteTree. USDC 10-day change (inverted axis) in supply ($) with bitcoin price ($) 2021year to date.
Issuance is something we would be keen to add to flow analysts as the data set grows.
Summary
The price is strong, yet we remain perplexed by the widespread use of incorrect data. There is no accusation of foul play, just an incorrect signal which is being used to push the idea that bitcoin is significantly undervalued. Using data from ByteTree and Blockchain.com you come to a different conclusion. We know we are right because we know how to recreate the incorrect version.
If still in doubt, look at Glassnode’s HODL waves. It tells you how long addresses have been inactive. In a nutshell, when activity increases, the amber lines rise and vice versa.
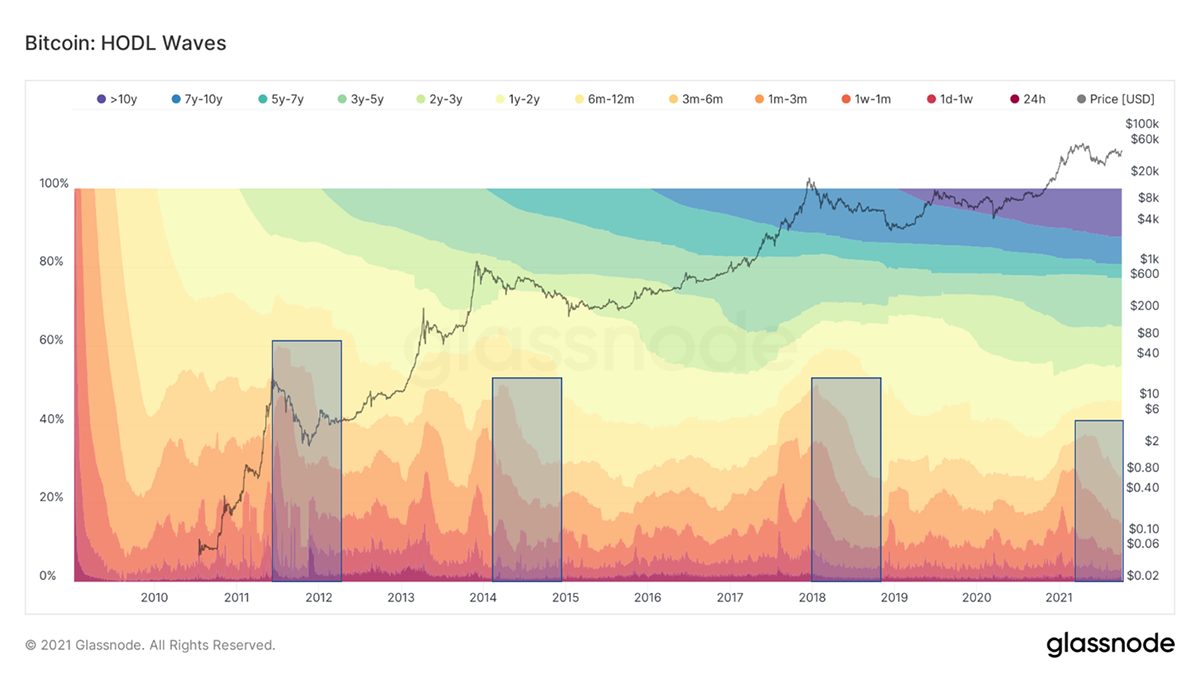
The highlighted boxes show bear markets where the short-term active supply has contracted. Or, to put it another way, many addresses have gone to sleep. How can it be that today’s network activity is greater today than it was in April? It can’t, and no one seems to care.

