

Week 43 2021
The Network Demand Model remains at 2/6 this week. The transaction volume trends remain very healthy, with both long- and short-term signals positive. As we’ve discussed before, the fee indicators take time to catch up, but the underlying momentum is constructive, especially if we look at the numbers since the “China ban” back in April/May.
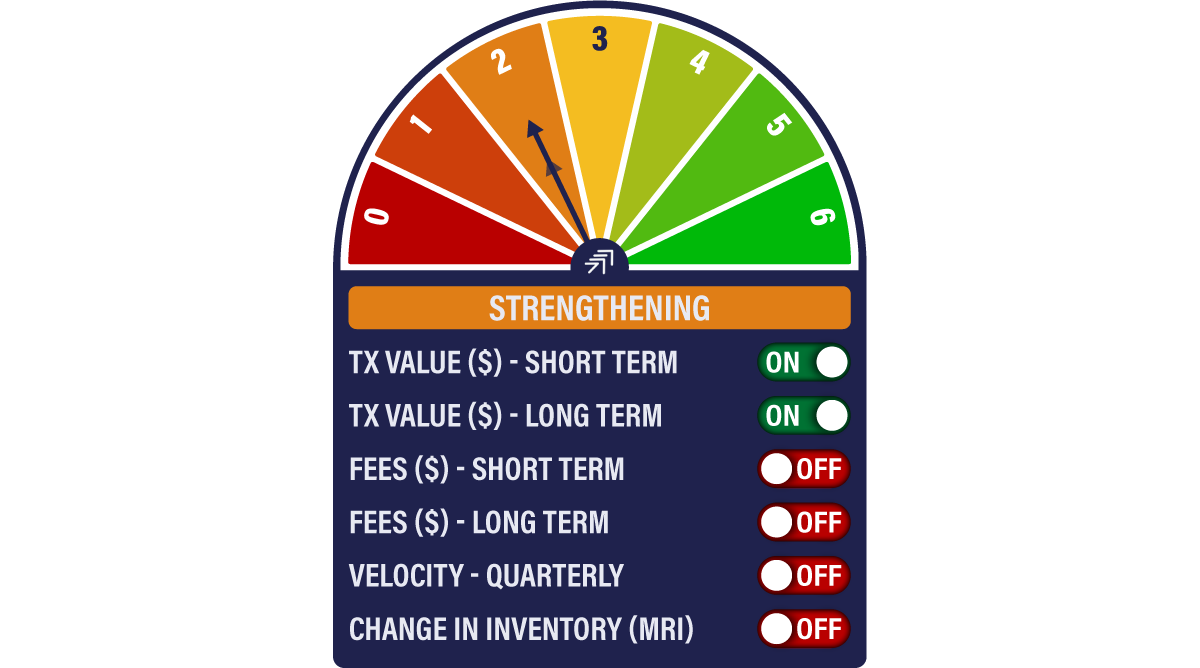
Miner’s Rolling Inventory remains in a low range. We can argue this both ways - either they are in no hurry to offload newly minted coins, or, alternatively, they don’t see a strong bid into which to sell. Given that we’ve just seen a new BTC futures ETF add over US$1bn to the eco-system in 3 days, with no impact on miner behaviour, it looks like they have neither the need nor inclination to sell at this point. This contrasts strongly with the sell-off into the “Musk-spike” earlier in the year.
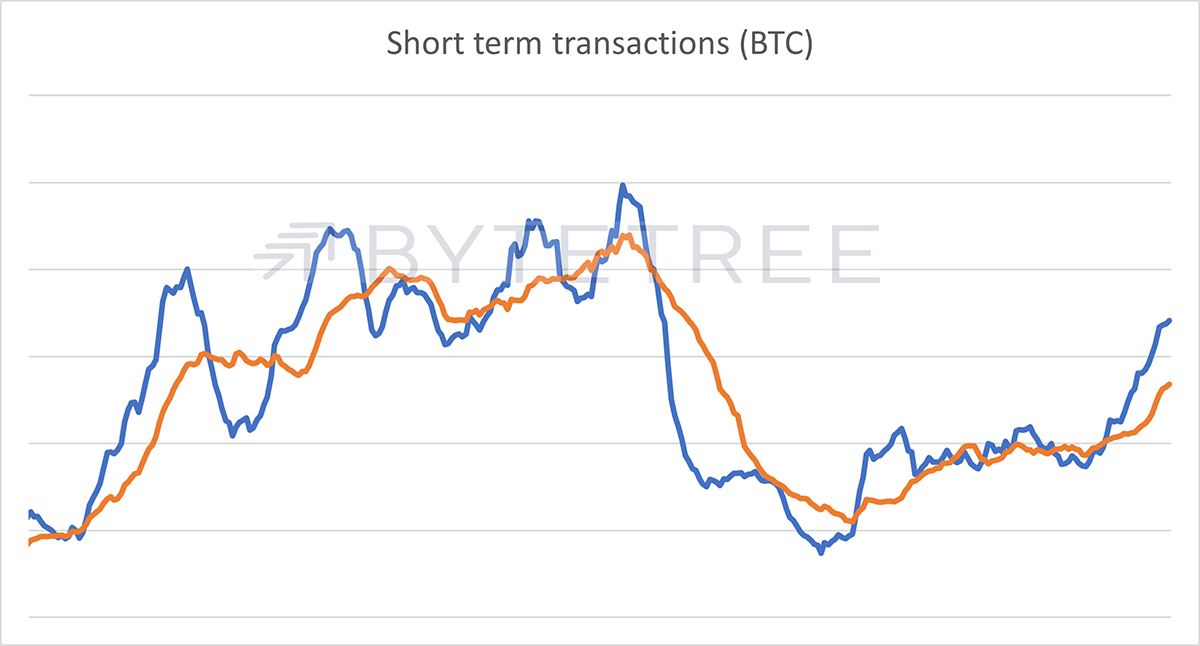
Short-term transaction series shows a robust uptick in activity
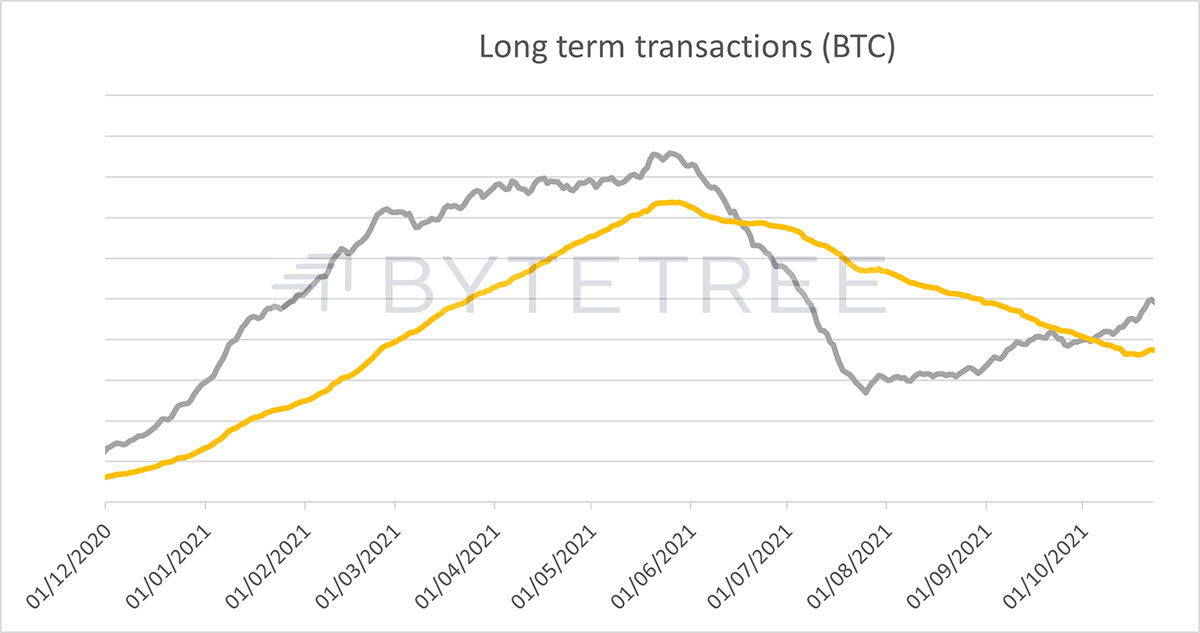
Longer-term transaction indicator (yellow line) now sloping higher in the longer-term series
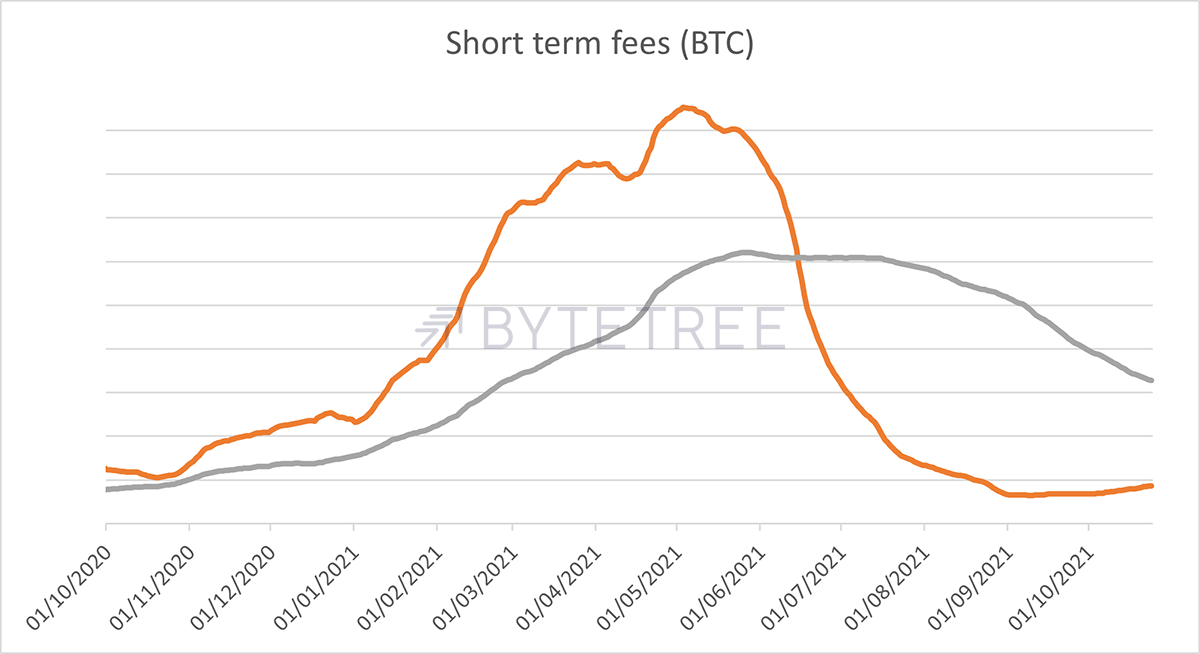
Fees continue to recover steadily post the China ban (note that the orange line is now sloping upwards)
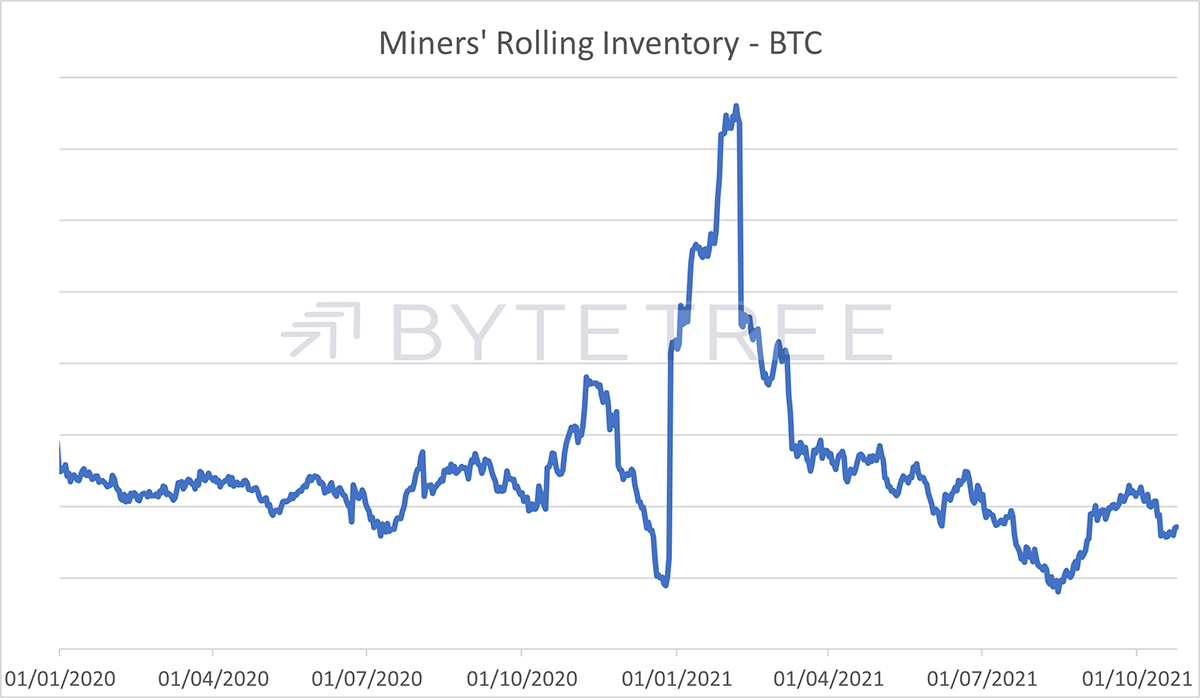
The recent uptick in network activity hasn’t changed miner behaviour, an indicator that they are happy holders, unlike the spike earlier this year when they sold heavily into the frothy market conditions caused by Elon Musk.


