Bitcoin Network Demand Model

Disclaimer: Your capital is at risk. This is not investment advice.
Week 42 2021
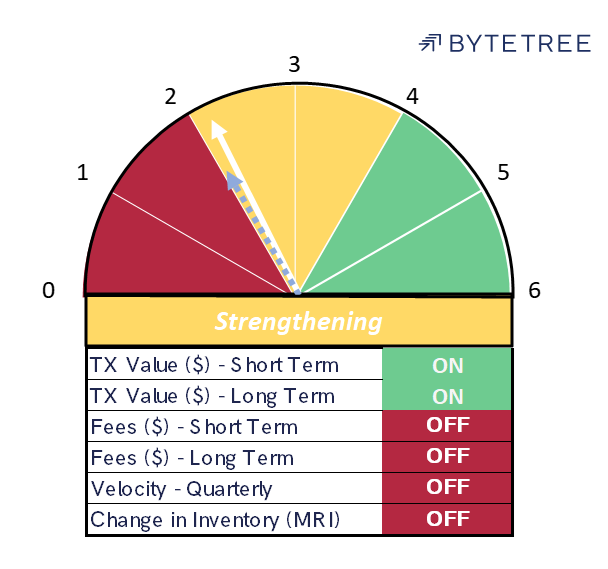
The Network Demand Model score remains at 2/6 this week, with most indicators continuing to strengthen. Transaction values are rising steadily, and fees continue to move higher. Miner’s Rolling Inventory has flagged a little, but the miners are, broadly speaking, selling what they mint, so there’s no major disconnect with other network activity.

Since the middle of the year, the one metric that has been significantly out of sync is the velocity signal. This measures the deviation of transaction activity from a 2-year median and is designed to give us a valuation sense check. When the deviation is high, we can say that the market is paying more (or less, depending on whether the deviation is positive or negative) than has historically been the case.
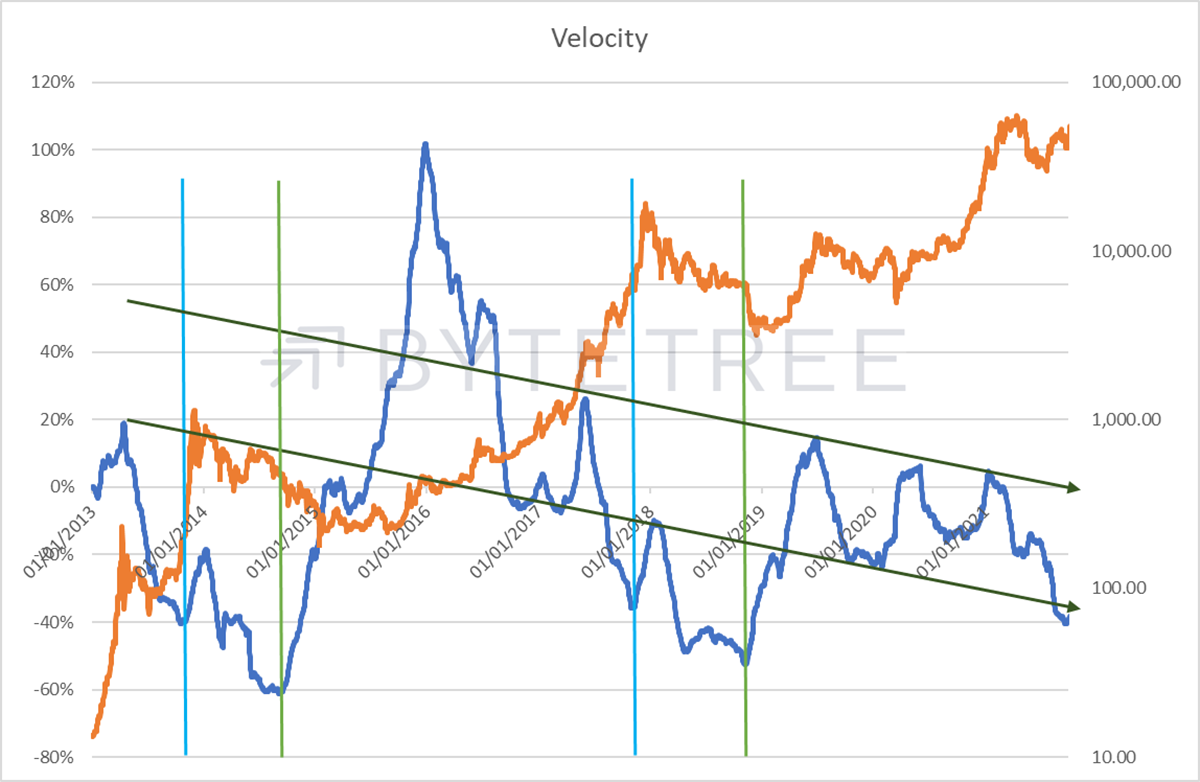
The extent of negative deviation that we now witness has been meaningfully lower twice before, first in September 2014 and then again in November 2018, as shown in the vertical light green lines in the chart below. On both occasions, this preceded a sharp drop in the price, which marked the end of those respective bear markets and set up the foundation for the massive bull markets into 2017 and 2021, respectively.

On the flip side, the levels we currently trade at were also see in the run-ups to the 2014 and 2017 peaks, as shown by the vertical light blue lines. A recovery in velocity from these levels would therefore suggest there is another leg in this bull market.
We can also observe from the chart that the long-term direction of travel is downwards, as shown by the two arrows. This makes sense. As an asset class grows and becomes more liquid, its risk profile reduces, and markets accord it a higher valuation.
This begs an intriguing question. The major event of this year was the Chinese ban on crypto trading and crypto mining. At the time, it triggered a huge risk-off move, yet with hindsight, we can argue that the outcome is unambiguously positive for the ecosystem. The removal of China as the dominant player in the upkeep of the Bitcoin Network has removed a major risk. Therefore, it makes sense for the market to re-rate accordingly.
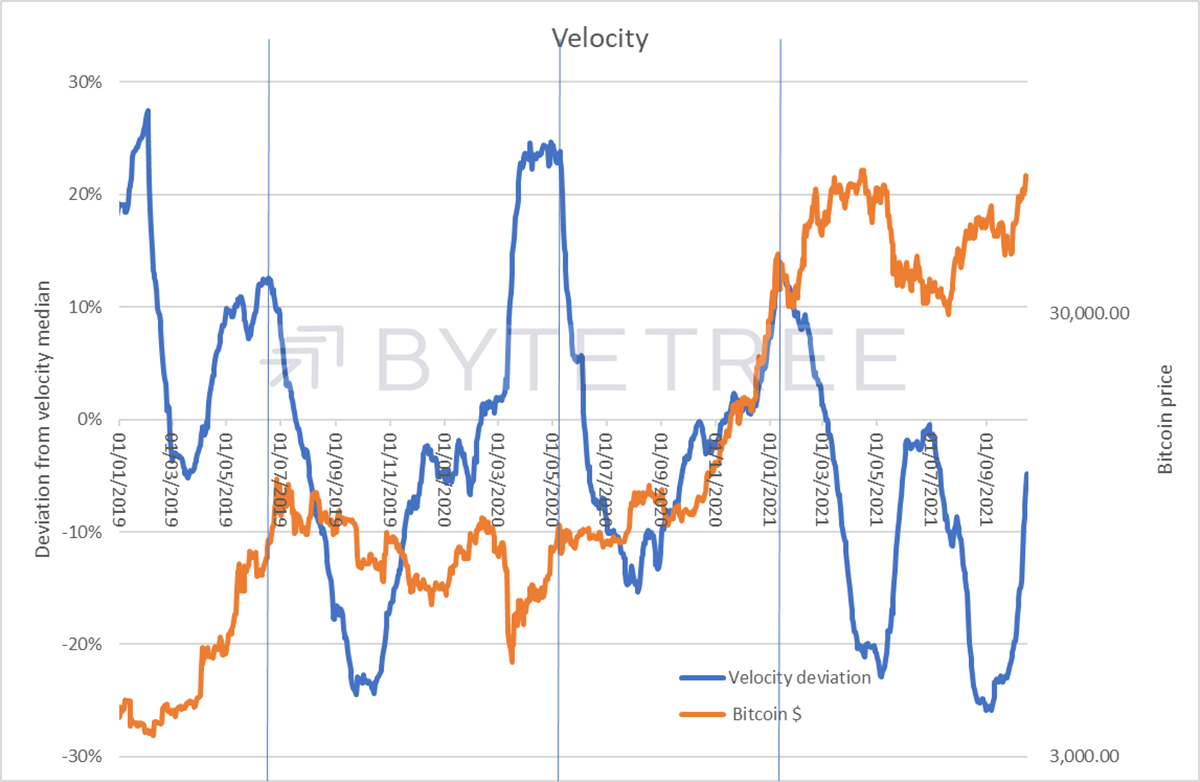
Purely by way of experiment, let’s look at the deviation from median velocity on a 4-month rolling average, rather than 2 years, to adjust for the possibility of a post-China re-rating. In other words, we are looking at the valuation the market has ascribed to bitcoin since the start of June.

You can see from the chart that the blue line has moved back into broadly neutral territory. This suggests a couple of possibilities. First, that bitcoin has re-rated and now trades at a level that doesn’t suggest material downside risk. Second, we only need to worry about sharp moves in either direction when we see momentum change. It makes sense to be proactive at major turning points, and we aren’t at one yet.

Comments ()