Week 40 2021
The Network Demand Model remains pinned at 0/6 this week. Even the October month start rally has failed to ignite on-chain activity. This suggests that the price move isn’t backed by an improvement in network adoption and activity, but instead by more speculative behaviour within the ecosystem.
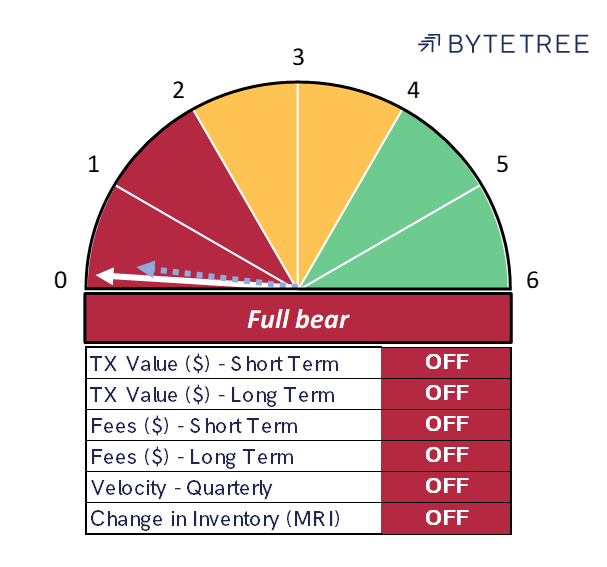
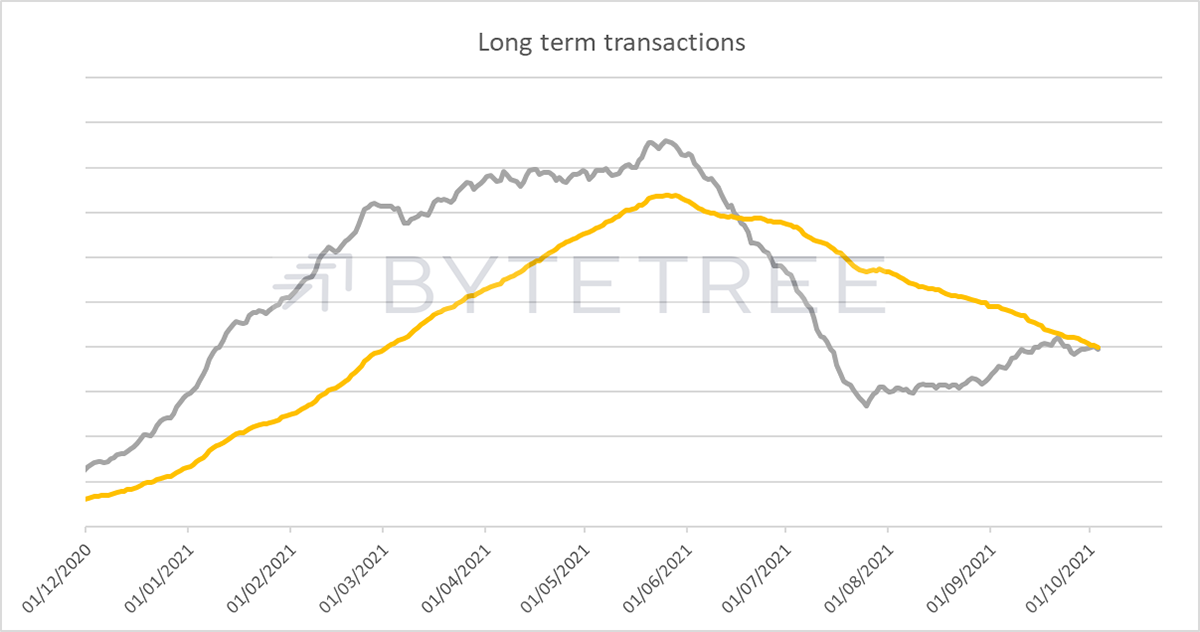
It’s possible that bitcoin will settle down and find a base price as transaction indicators return to a more settled level following the spike at the start of the year. Both the short- and long-term indicators are close to turning on again, although we had hoped this would have happened by now.
We are keen to draw attention to the giant disparity between ByteTree transaction data and that of some of our competitors. This is a subject we will be talking about in more depth in the coming weeks, but suffice to say there are sources in the market which are grossly overstating market activity. This is because they measure raw outputs as being the transaction value rather than filtering the data to understand what is truly economic.
It is analogous to buying a bar of chocolate for 50p, handing over a £1 coin and being given 50p in change. Our view is that the economic value of that transaction is 50p. The data that many are basing their investment decisions on measures that transaction as £1.50, because they measure the value of the coin given to the shopkeeper (which contains the price of the chocolate bar), and the change returned to the customer. Without filtering and analysing the data, there is no useful economic information at all.
This why our valuation data continues to tell us that the Fair Value is some way below where bitcoin trades today.
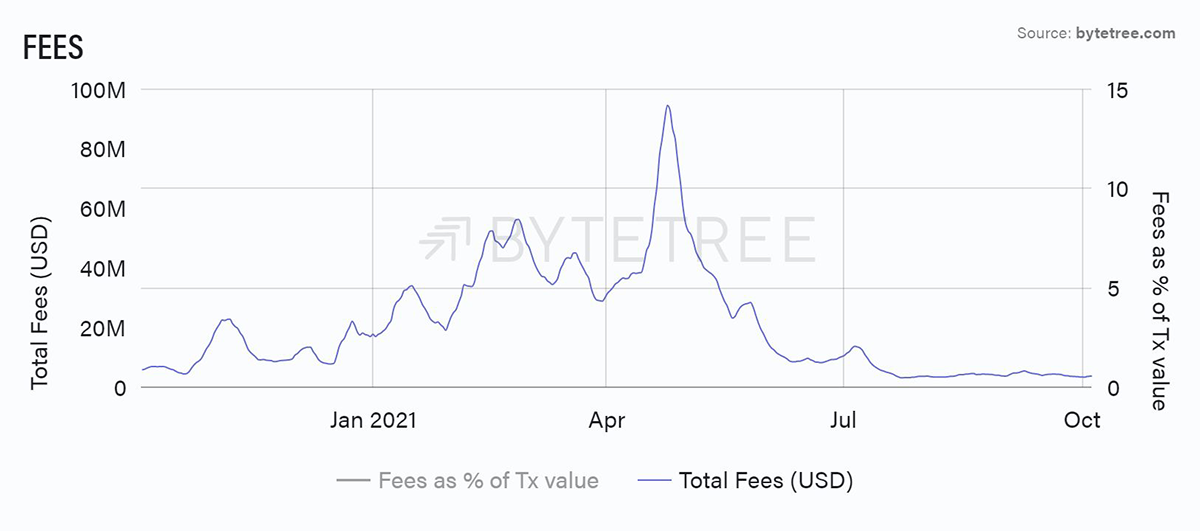
This view is corroborated by the behaviour of fees, which completely contradict the idea of a healthy network. If transaction activity was so healthy why would fees be so depressed?
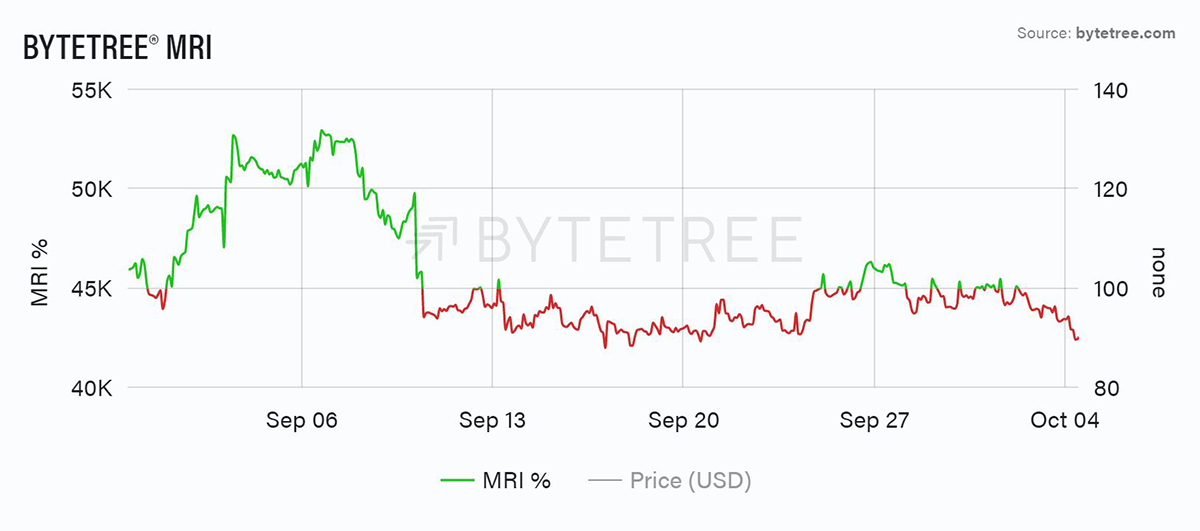
Miners’ behaviour continues to be phlegmatic. The early September spike in inventory reduction (probably the China ban) is coming out of the numbers, which means that the MRI series is likely to start pointing down again. This could indicate increased miner speculation and/or hoarding. Several miners in the West have utilised the stock market to finance their next stage of growth, so they don’t need to liquidate inventory to finance operations. However, the need to spend on new equipment (capex) in this industry is relentless, and prices are high. Hoarding can’t last forever, and unspent inventory continues to rise.
Our view remains that a declining MRI is not a sign of a network in good health.