

Week 39 2021
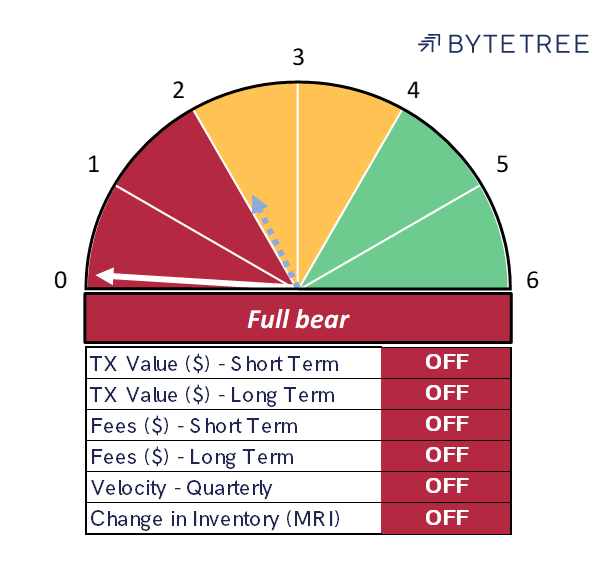
The Network Demand Model has once again turned south, with a reading of 0/6, down from last week’s 2/6. Unexpectedly, both the short-term transaction and the Miner’s Rolling Inventory indicators have softened. Additionally, the long-term transaction indicator, having looked like it would turn positive again, has lurched south. The news that the Chinese authorities are stepping up efforts to clamp down on cryptocurrencies has clearly had some impact on network activity.
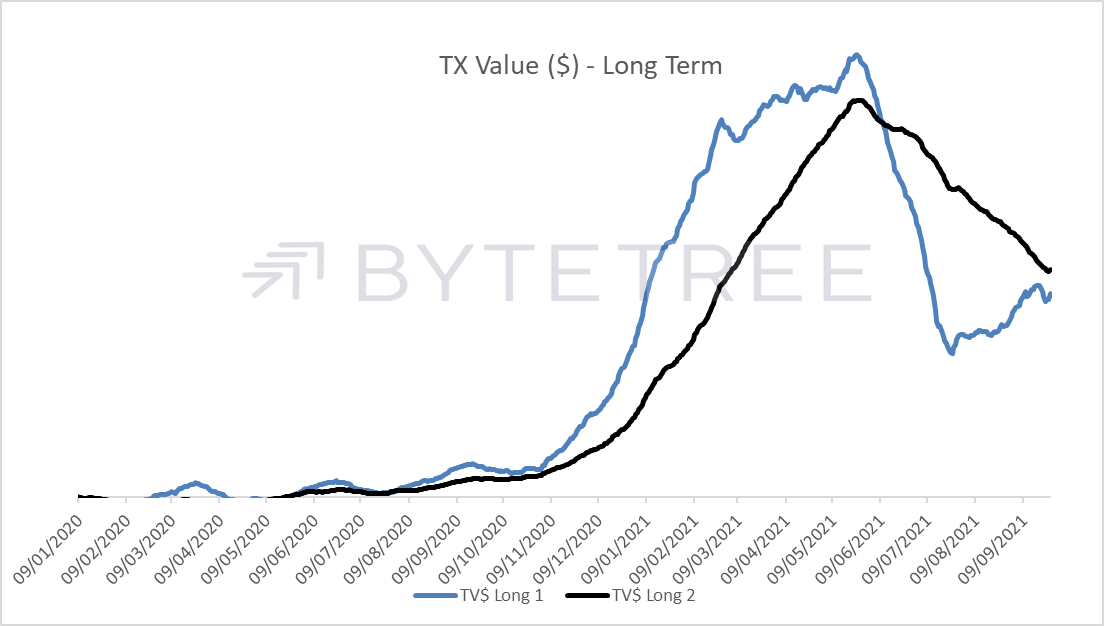
Long-term transaction indicators roll over just when looking likely to confirm a recovery.
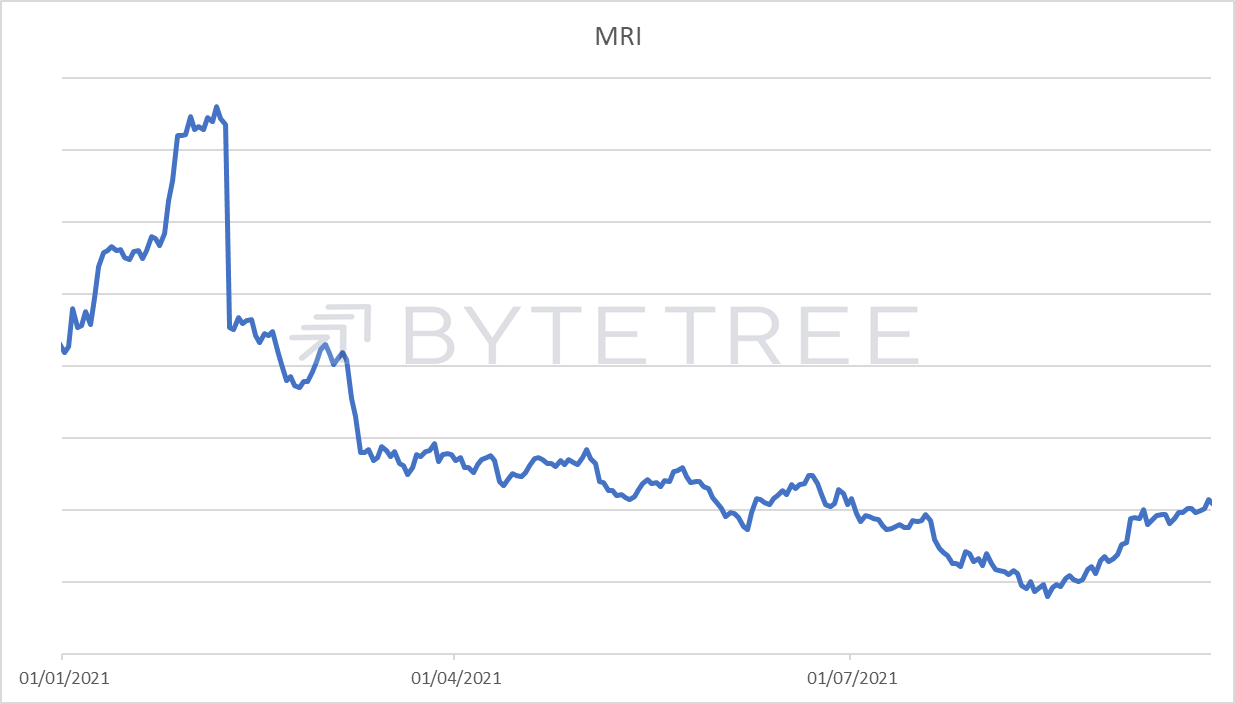
Miner activity remains subdued from a longer term perspective, but with the price so high they have no need to panic sell.
It is of note that the reduction of network activity since the first of this year’s Chinese clampdowns (in May), has coincided with a period in which bitcoin has traded at a significantly higher premium to the ByteTree Fair Value than historically, as shown in the following chart.
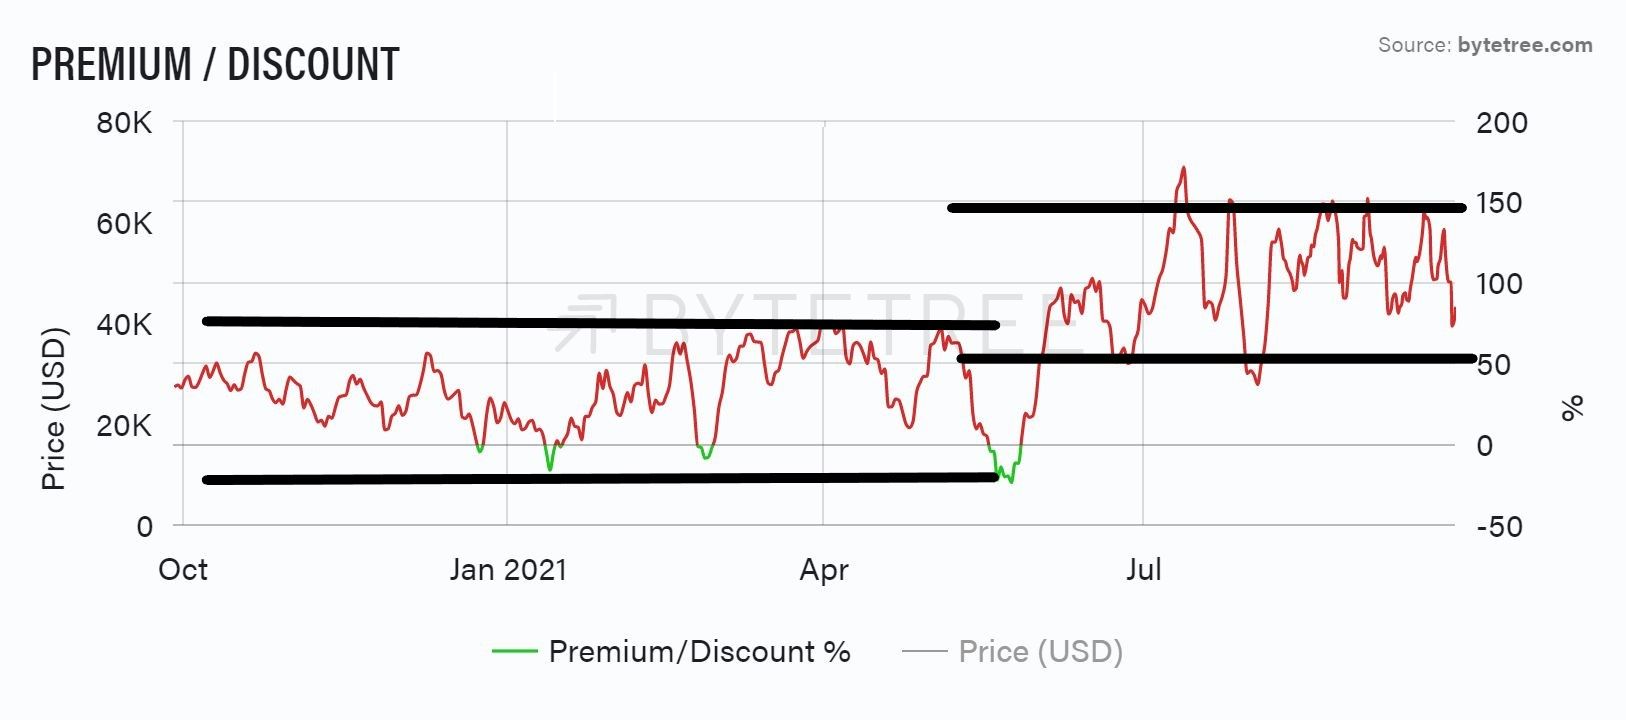
We can only speculate at this stage why this is and whether it is sustainable. A bullish view, however, would be that this move by the Chinese authorities has significantly de-risked bitcoin; firstly by removing a political threat to bitcoin’s control and secondly by reducing the network’s reliance on fossil fuels. These two factors will serve to strengthen Bitcoin’s security and independence, as well as enhance its green credentials. As institutions continue to move towards the space, so the valuation may be re-rating accordingly.


