Week 37 2021
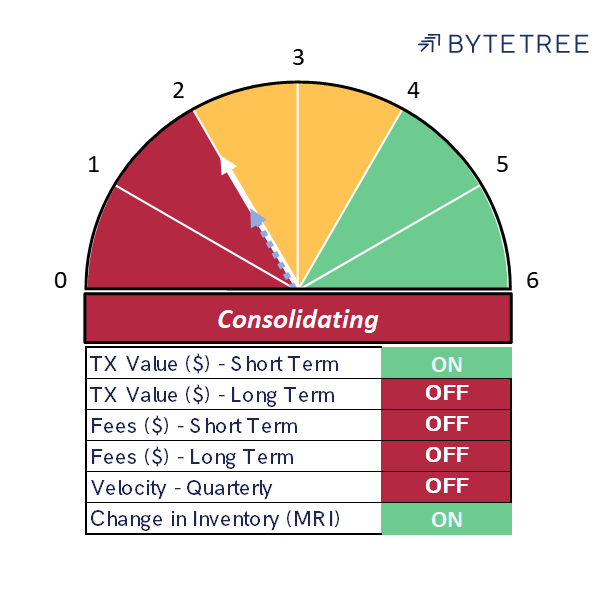
The model is unchanged this week on 2/6, with short-term spend and miners’ inventory remaining the two signals that are “on”.
What remains remarkable is how weak the velocity signal is. This is as close to a valuation metric as is contained in the model, being essentially an inverted price/sales ratio.
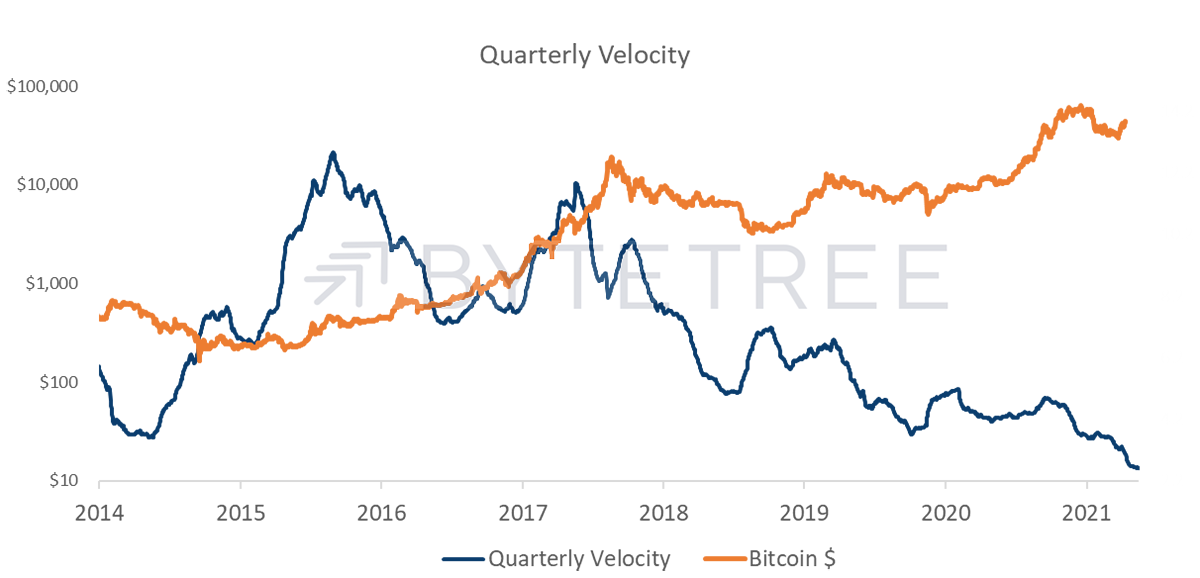
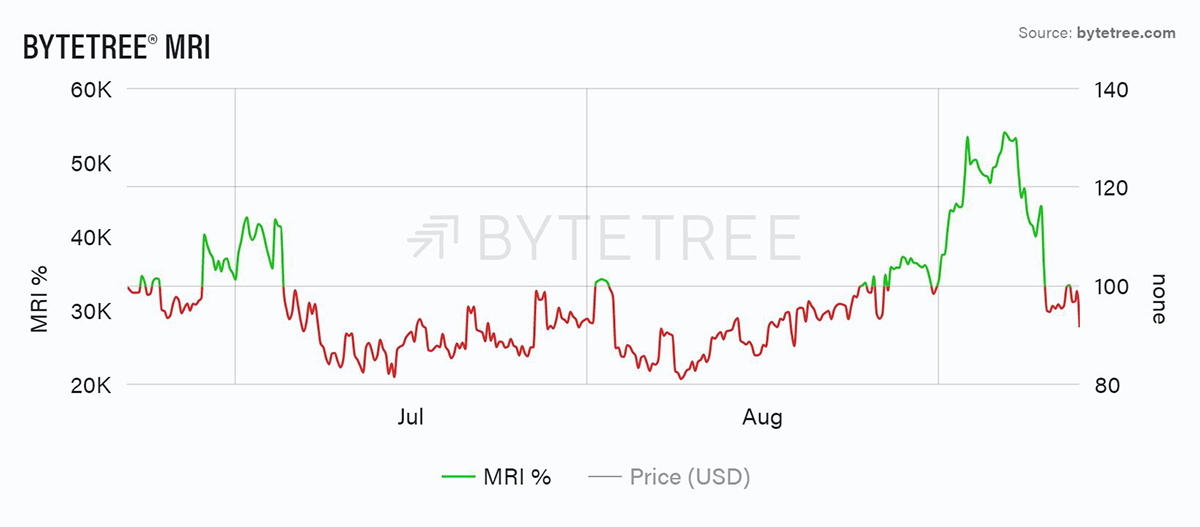
Viewed over an extended time frame, the velocity metric is clearly in a structural downtrend, which suggests an investor base less inclined to trade. However, on closer inspection you can see that it has been rare for bitcoin to sustainably move higher without a 6-18 month period of velocity improvement. It was the case leading up to the April/May peak this year, but worryingly has shown no sign of recovery since. While HODLing is great in theory, there is a risk is that hoarders are simply creating a large overhang should the rationale for owning bitcoin become impaired.
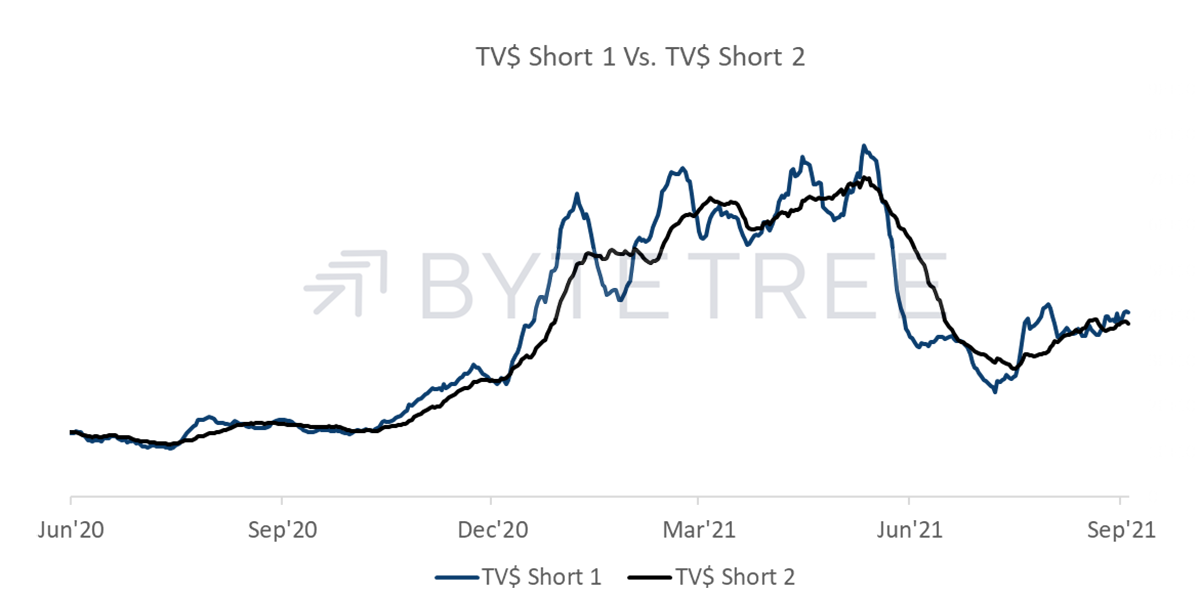
While transaction values have been trending gently higher of late, as shown below, they are only at levels seen in mid-December 2020. Taken together with our valuation methodology, this reinforces the idea that the price has moved some way ahead of network fundamentals.
The miners have enjoyed a good month, which is generally a sign of a market in a healthy state of network equilibrium. However, be mindful that this burst of activity might be short-lived. As we look back over the last 12 weeks on the Terminal, it’s clear that the recent strength might be an aberration rather than a trend.