Week 36 2021
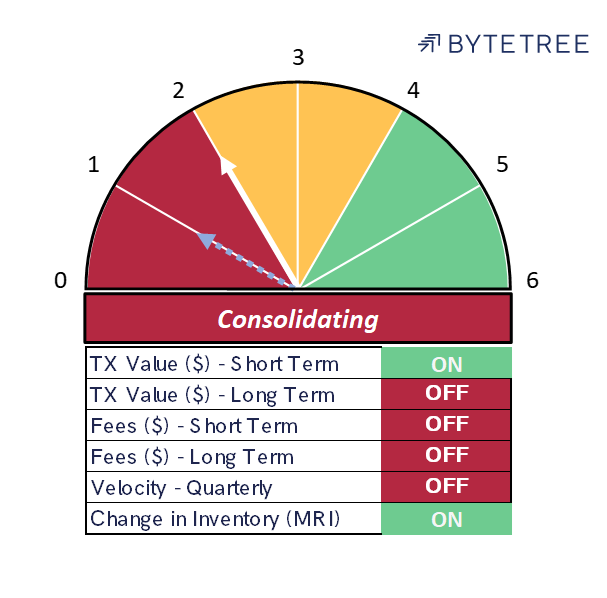
The Network Demand Model reads 2/6 this week, with an uptick in miner activity triggering an increase from 1/6 last week. All metrics apart from coin velocity are confirming an improvement in on-chain activity.
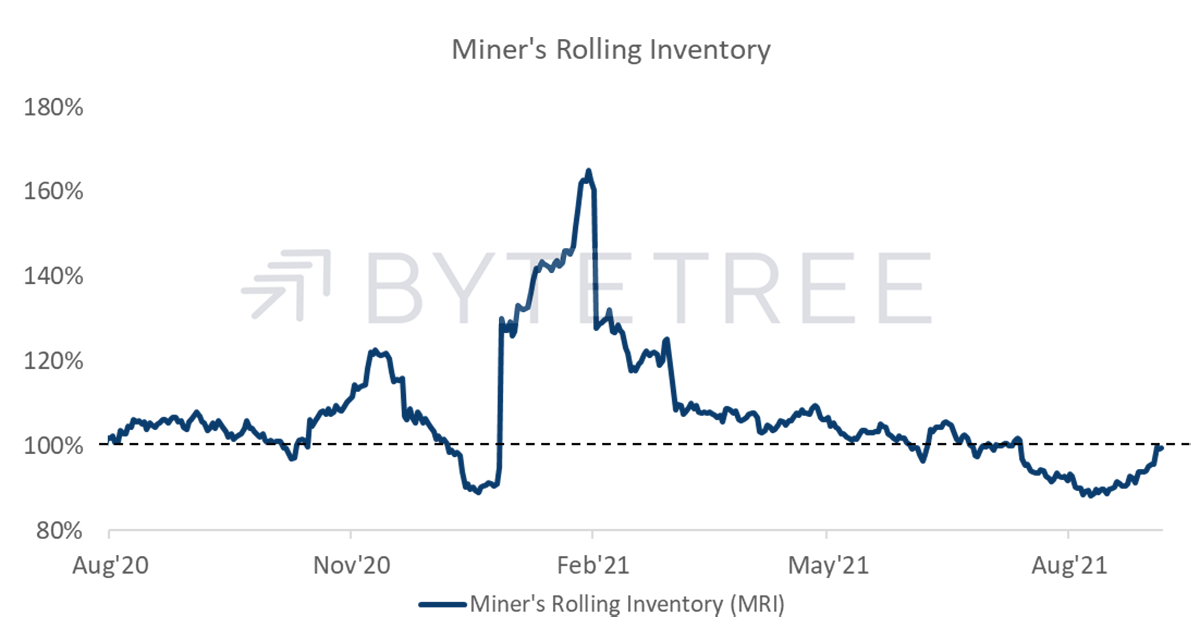
MRI (Miner’s Rolling Inventory) has picked up markedly, as shown below. The bitcoin price has held up well during this phase which tells us that the miners are selling into a firm bid rather than dumping into a weak market. It also suggests that investors have returned from the summer break and are looking to increase allocations to the asset class.
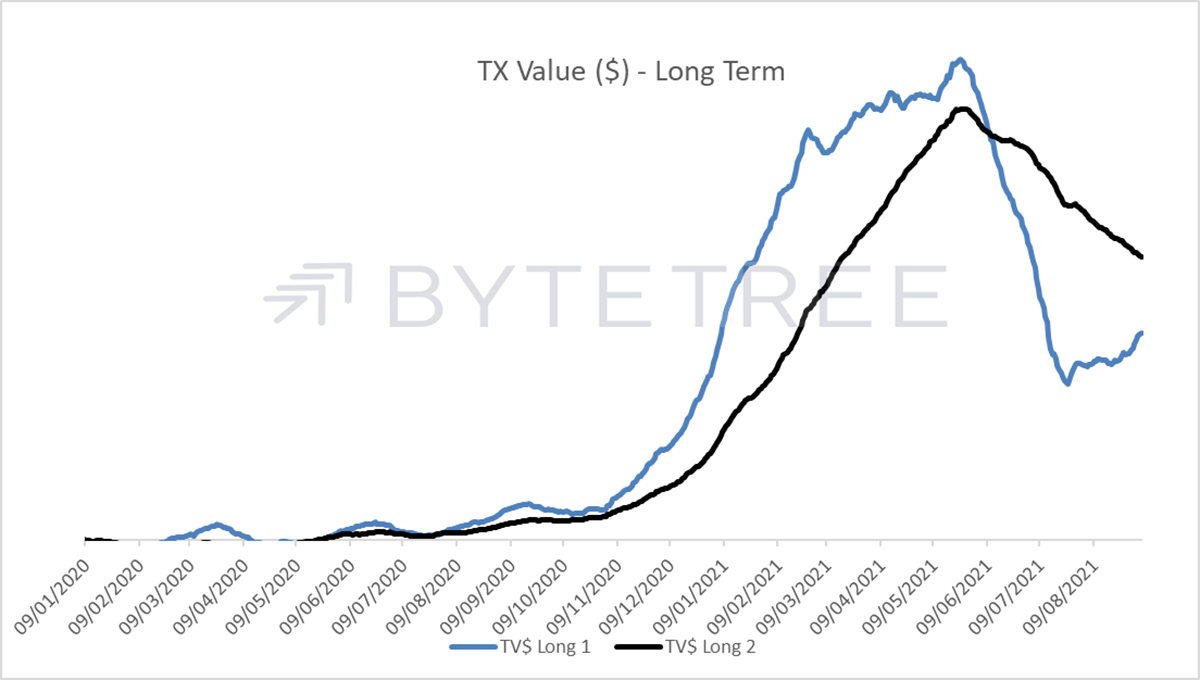
This is corroborated by an ongoing, but unspectacular, recovery in transaction volumes. The short-term indicator is already “ON”, but the longer-term is now rapidly catching up.
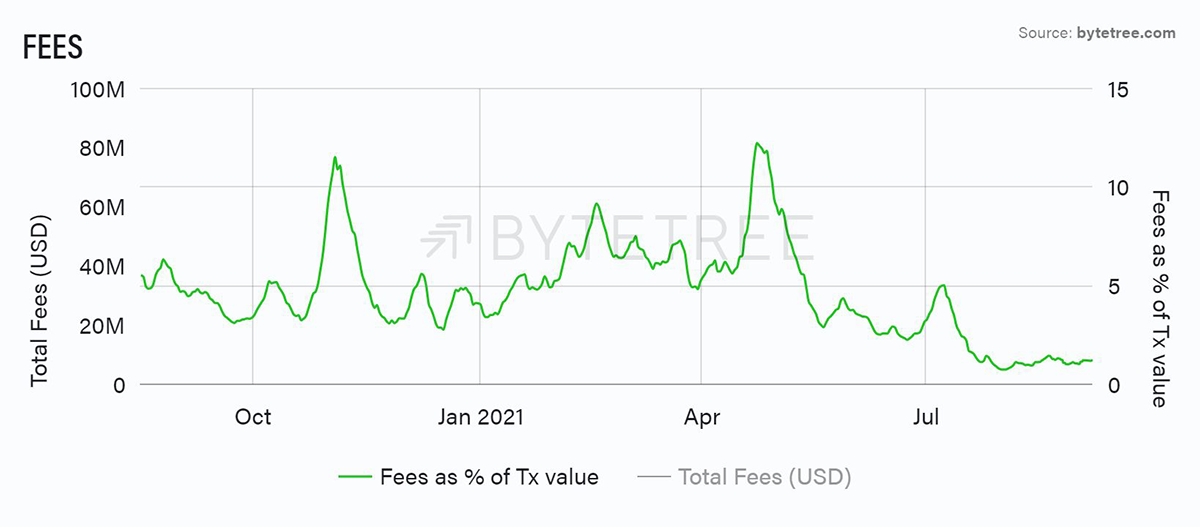
Fees continue to look depressed, but the increased adoption of Segwit (which reduces the amount of data processed in transactions) might be the reason behind this. If so, it suggests the network is far from the congested levels that suggest that bitcoin is overheating.
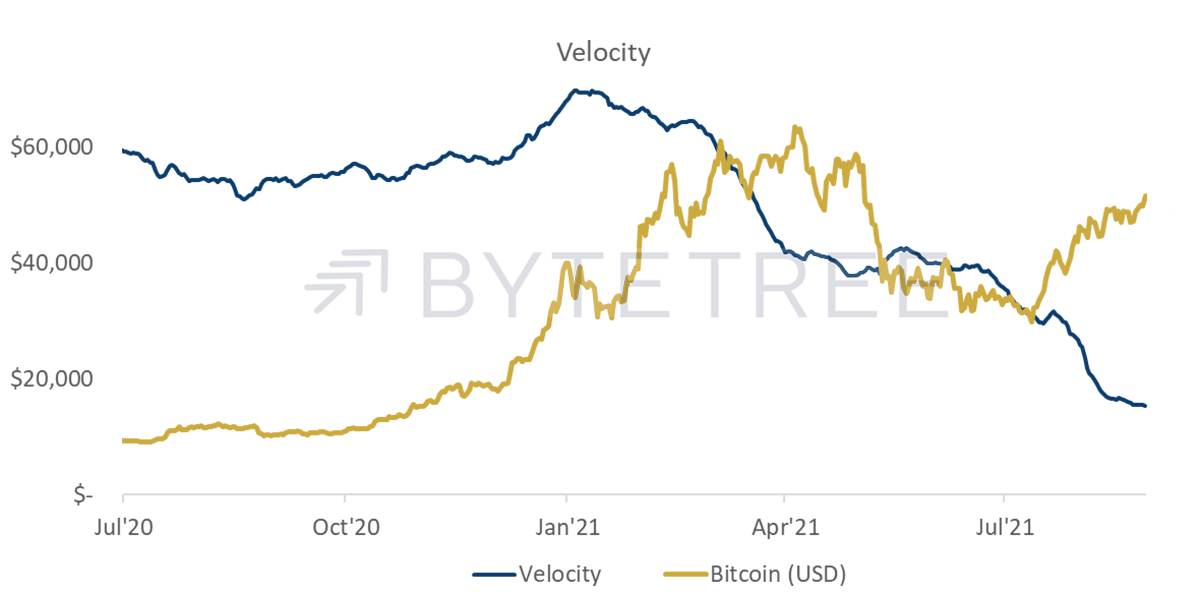
One concern remains the low level of velocity, although again it might cut both ways. The current low level suggests that investors are increasingly adopting a buy-and-hold attitude, consistent with the notion of bitcoin as “digital gold”. In a bull market, this reduces supply and helps maintain momentum. Conversely, in a bear market, the growing size of static holdings could form a significant market overhang.