

ATOMIC 11
The $48k level was first broken in February this year. I kid you not, but between then and the breakdown in May, just under 1 trillion dollars of bitcoin changed hands, which is 22% of all historic network activity since 2009 in just under 100 days. Little wonder it was followed by a cooling-off period.
ByteTree ATOMIC
Highlights
| Technicals | Resistance zone |
| On-chain | Remains soft |
| Macro | China |
| Investment Flows | Still soft |
| Crypto | Coinbase cleans up |
Technical
The rally has continued with an intraday high of $48k on Saturday. That is where the pre-May resistance zone begins. The last touch occurred on 25 April, highlighted by the green line.
Bitcoin trend
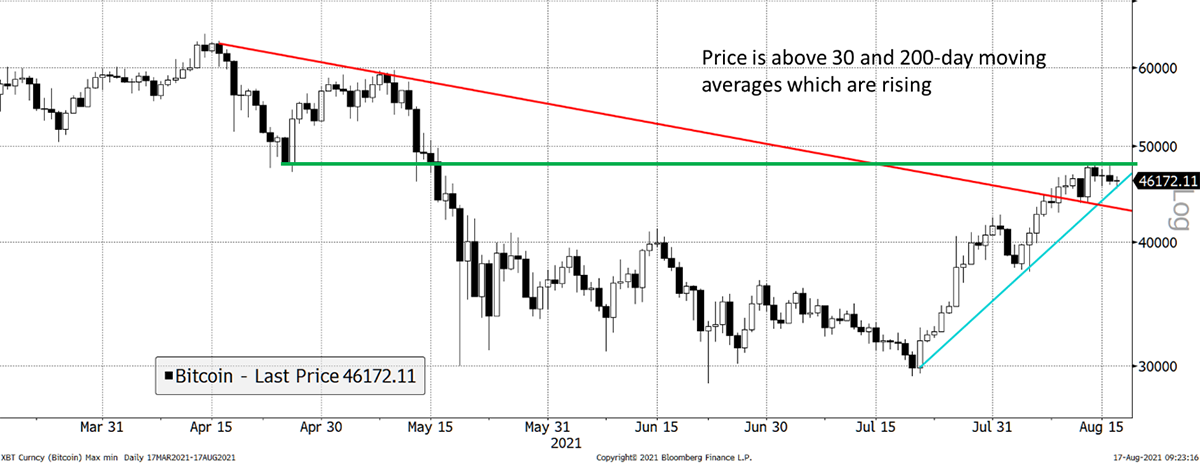
Source: Bloomberg. Bitcoin past three months.
The other two trendlines are the red downtrend line from the April high and the blue uptrend line from the July low. The red line was broken last week, which is bullish, but I suspect the green line may take time to overcome. It marks the start of the resistance zone.
The $48k level was first broken in February this year. I kid you not, but between then and the breakdown in May, just under 1 trillion dollars of bitcoin changed hands, which is 22% of all historic network activity since 2009 in just under 100 days. Little wonder it was followed by a cooling-off period.
The trend is in good shape, but don’t forget that volatility is still 55%, lower than we have recently seen but still high compared to other assets. Trends with low volatility are generally more reliable and sustainable than trends with high volatility. It simply means things can change quickly.
But right now, it looks good. The price is above trend on all measures.
Trend upward
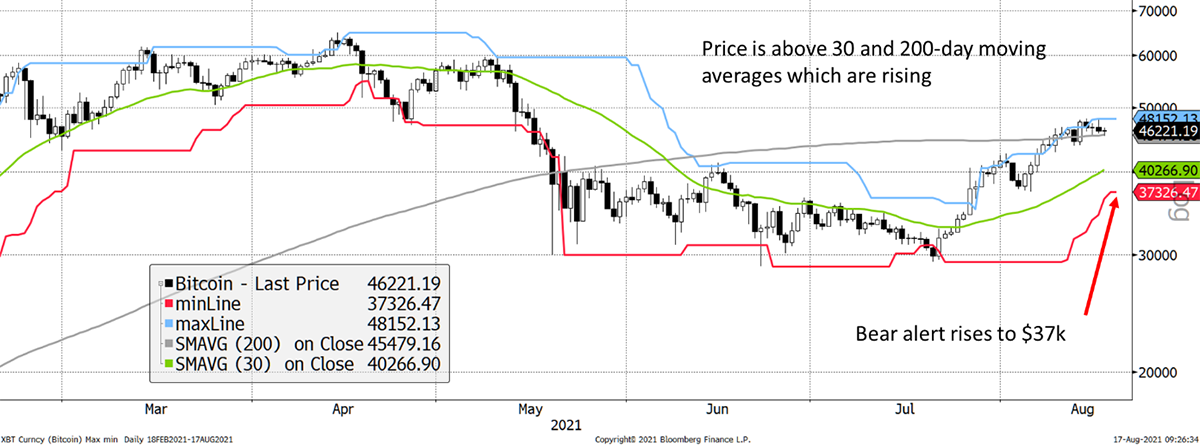
Source: Bloomberg. Bitcoin with 20-day max and min lines, 30-day and 200-day moving averages past six months.
A rising price also pulls up the 20-day low, which, at $37k, is quite a long way down. This will pick up quickly and provide a new trend floor. As a rule, when the price is volatile, I prefer to use 20-day max/mins, and as it calms, I look to increase the time horizon.
On-chain
The gap between the level of on-chain activity and price remains wide. The calibration follows a longer-term average which is readjusted. This adjustment keeps on falling over time, but never have we seen a divergence come about so rapidly.
Valuation gap remains large
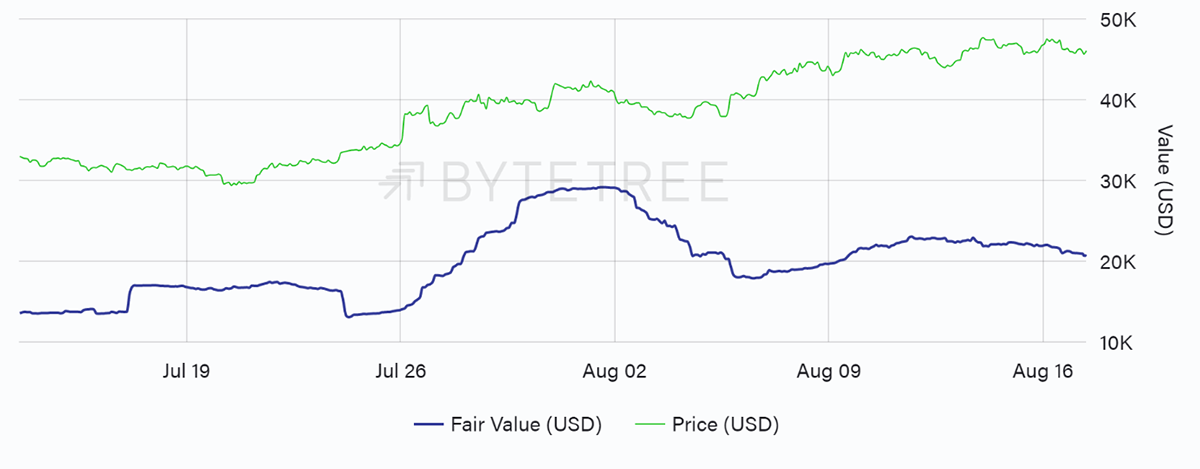
Source: ByteTree. Bitcoin Fair Value and price (in USD) over the past five weeks.
One reason for less bitcoin activity has been the shift in altcoin trading pairs. Only recently, altcoins were priced in BTC, but since the surge in stablecoins, the BTC crosses have been superseded.
Is that a problem for bitcoin? Not if you go with the digital gold narrative, but it is one less source of demand, as bitcoin is no longer the sole gateway to the crypto space.
The striking story of the week is the continued advance of miners’ inventories despite rising prices. Why are they HODLing?
Inventories rise
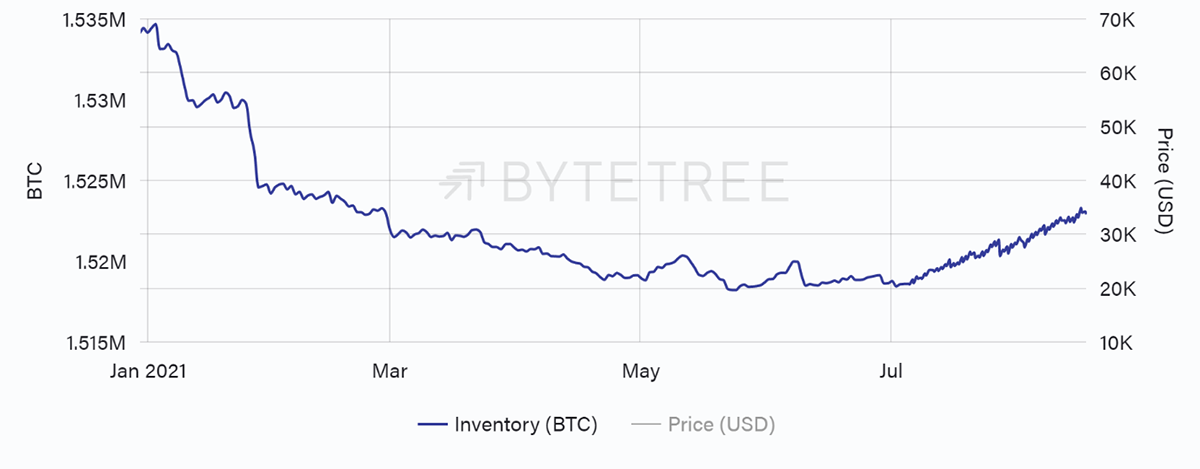
Source: ByteTree. Inventory (BTC) since January 2021 to present.
One reason is that the miners are enjoying the good times. Around the April peak, revenues (30-day) neared $2bn, which is heroic stuff. That collapsed with the price in May to a low of $700m, but so did mining difficulty.
High prices with low difficulty make mining profitable
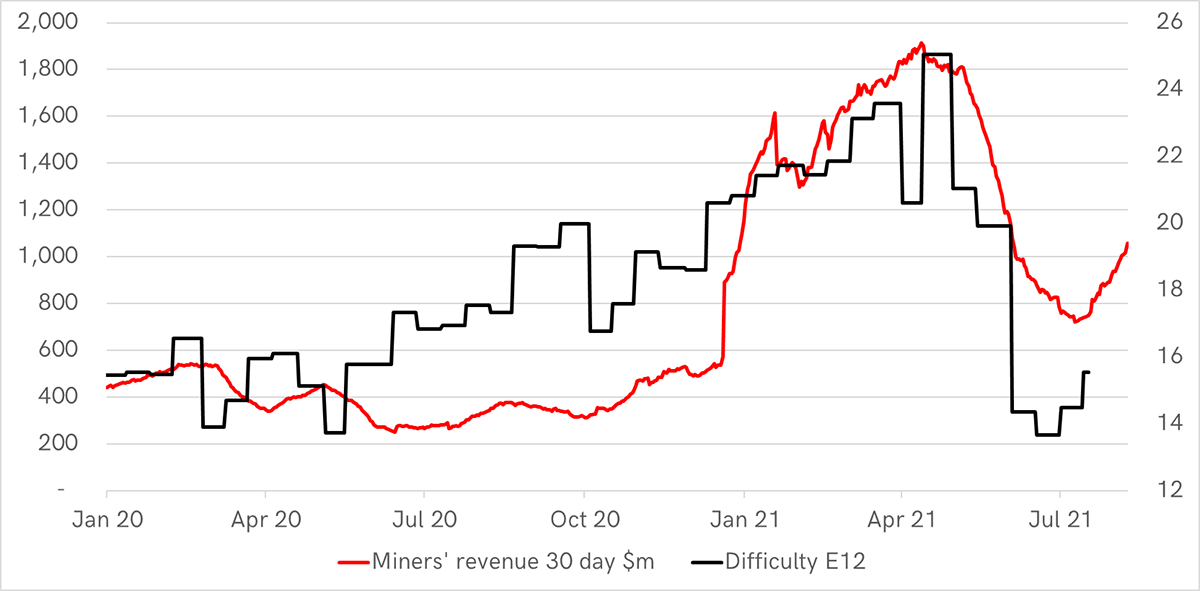
Source: ByteTree. 30-day miners’ revenue ($m) and difficulty (divided by E12) since Jan 2020.
Putting those together, you can see the dollars over difficulty. It is a simple way to show how they are currently earning lots of dollars while consuming less electricity.
Dollars over difficulty
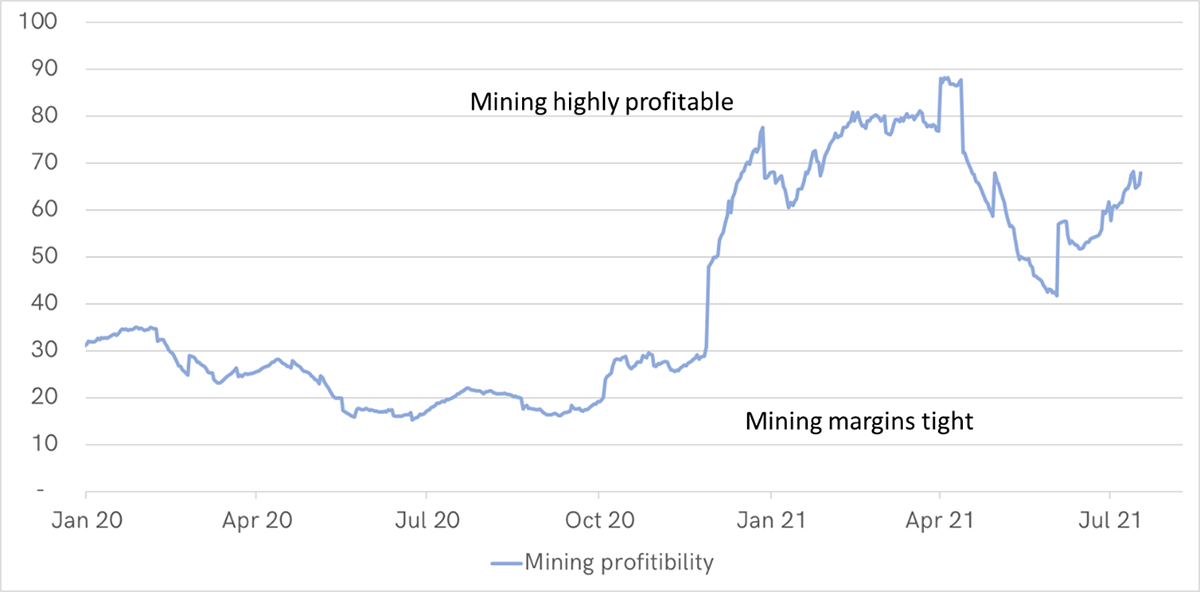
Source: ByteTree. 30-day miners’ revenue ($m) and difficulty (divided by E12) since Jan 2020.
With higher margins, it stands to reason that there are fewer bills to pay, and so a tactical HODL of some of their coins makes sense. At least they’ll likely HODL unless the trend turns down. If so, we would expect around 4k BTC (circa $200m) to come to market. It isn’t huge by bitcoin standards but unwelcome if the market bid softens.
But mining won’t remain easy for long. The average block time is around 550 seconds, so expect yet another upward difficulty adjustment a week on Wednesday. That too may flush out a few sellers.
Mining has shifted from hard to easy
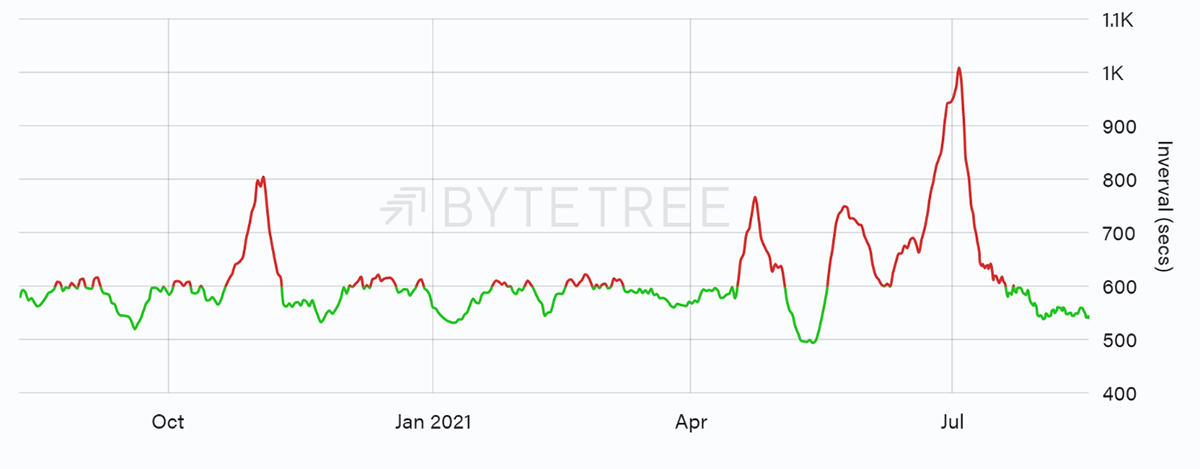
Source: ByteTree. The bitcoin block interval over the past year.
Investment flows
The ETF flows are flat, so no change there. But it is striking that the Grayscale discount has widened again to 13%. It could be that everyone prefers the Canadian ETFs, but much US institutional money is restricted from buying them. That leaves GBTC as the only option for many US investors.
Grayscale discount
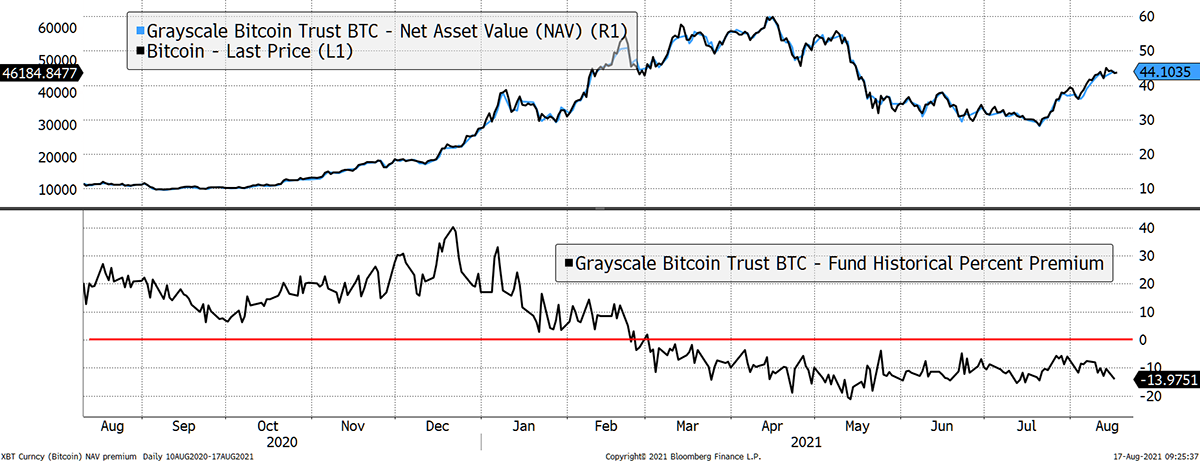
Source: Bloomberg. Grayscale Bitcoin Trust (GBTC) price and net asset value per share. Discount/premium lower chart past year.
I showed this last week as a lower discount would imply more demand. It’s not happening. With flat ETF flows and a wider GBTC discount, there is still no evidence that the institutions are actively buying bitcoin.
Macro
Many attribute the rally in hard assets to central bank printing. The link seems plausible enough, but the vibrancy in the jobs data and wages on both sides of the Atlantic raises warning signals that the best is behind us.
Central bank balance sheets
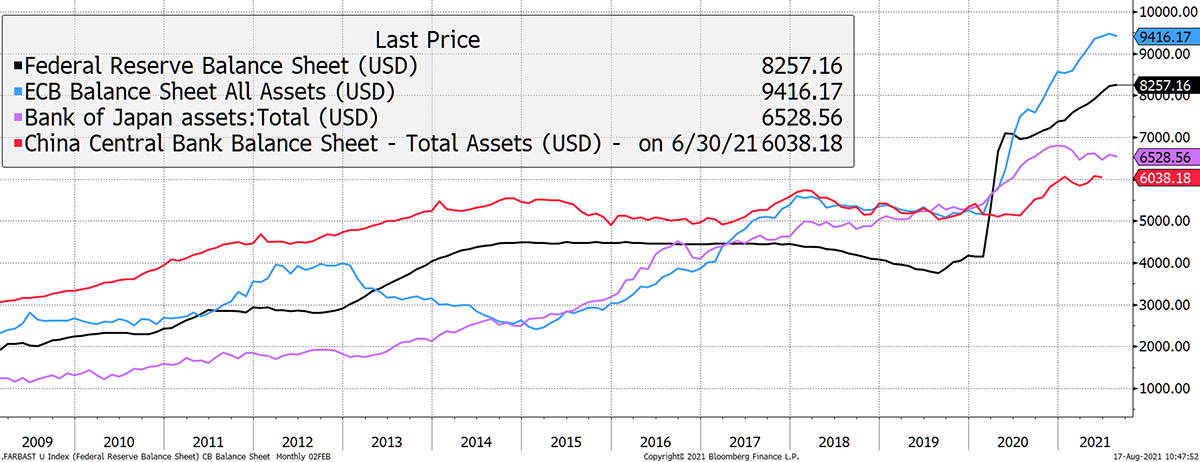
Source: Bloomberg. Central bank balance sheets in billions since 2009.
The data for China lags the world as their economy is on a different trajectory. But the stockmarket is renowned for its link to liquidity conditions and is turning down.
Chinese equities turn down
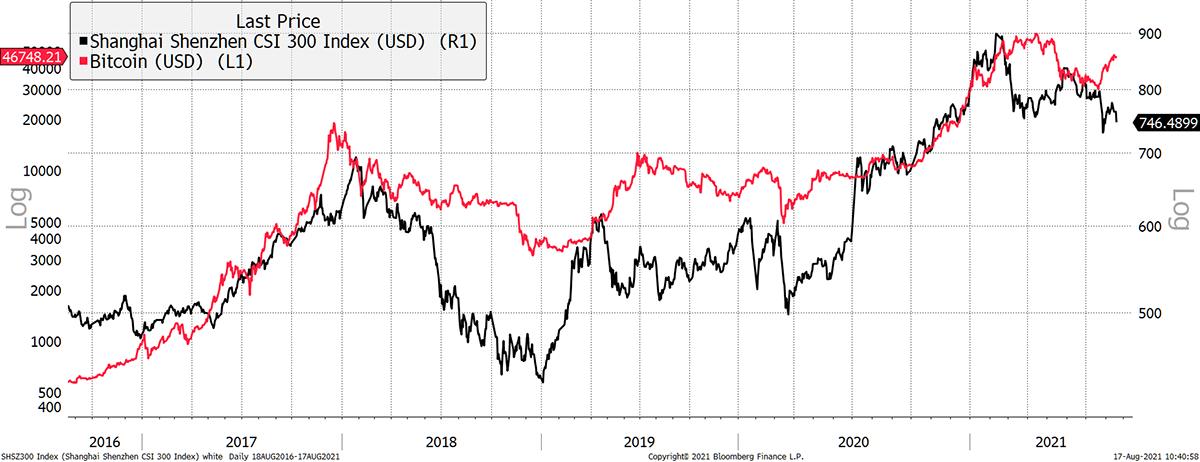
Source: Bloomberg. Shenzhen CSI 300 and Bitcoin since 2016.
Another spurious correlation with Bitcoin perhaps, and potentially less relevant as Chinese Bitcoin activity recedes, but it could be a warning for risk assets around the world. I don’t recall which strategist said it first, but I recall the comment: all market storms start in Asia. If true, Chinese equities may be telling us something.
Last week, I showed the weakness in Social Media stocks, in part due to a crackdown in China. This week, I show non-profitable tech stocks. There’s a sniff of the ARKK ETF about this. The surge in 2020 is incredible, and the April low is now being retested.
Social media comes under pressure
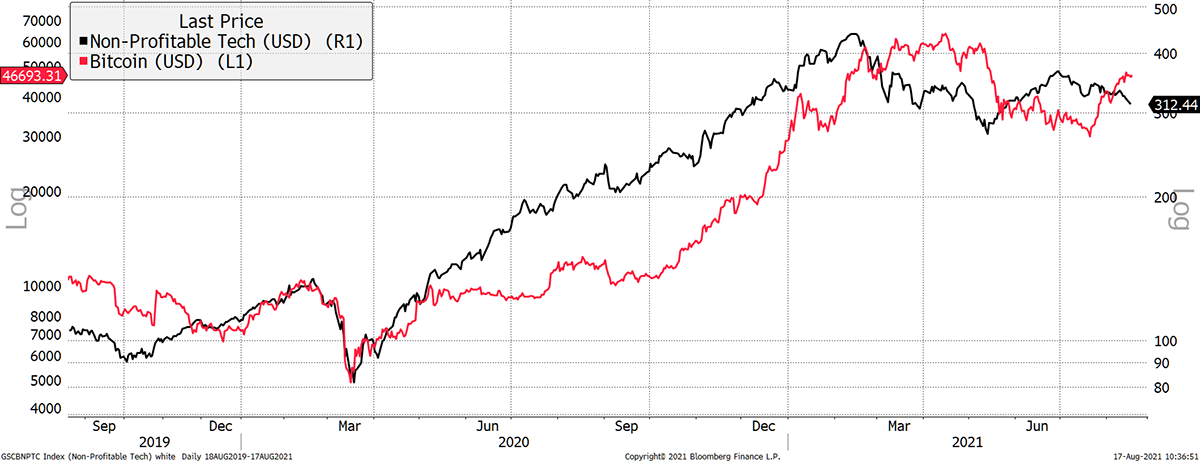
Source: Bloomberg. Goldman Sachs non-profitable tech Index with Bitcoin since 2019.
Bitcoin could go two ways here. It could still be a speculative asset linked to other speculative assets, and as they come under pressure, so will Bitcoin.
The other way is that Bitcoin turns into a lifeboat for a sinking system. Many believe that, but we have no evidence that it will hold true. Still, it’s the best bull story out there.
Crypto
Coinbase released its second quarter resultslast Tuesday after the market close, which were impressive. But the market didn’t think so as the shares are down 5% since, while Bitcoin is up 2%.
They have 68 million users and 9,000 institutions alongside 160,000 ecosystem partners that use their tools. Over the quarter, revenue was $2 billion. This is remarkable stuff.
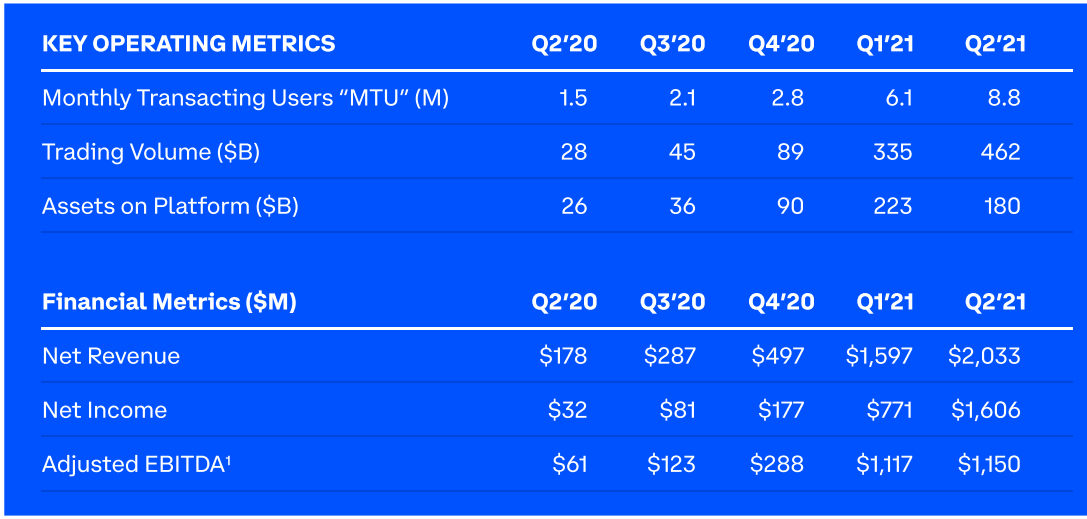
Source: Coinbase. Key Operating and Financial Metrics for Q2 2021.
They highlighted three scenarios for the rest of the year ranging from good to bad. The good showed modest upward growth, while the bad saw a return to Q4 2020. I was impressed by their honesty and openness.
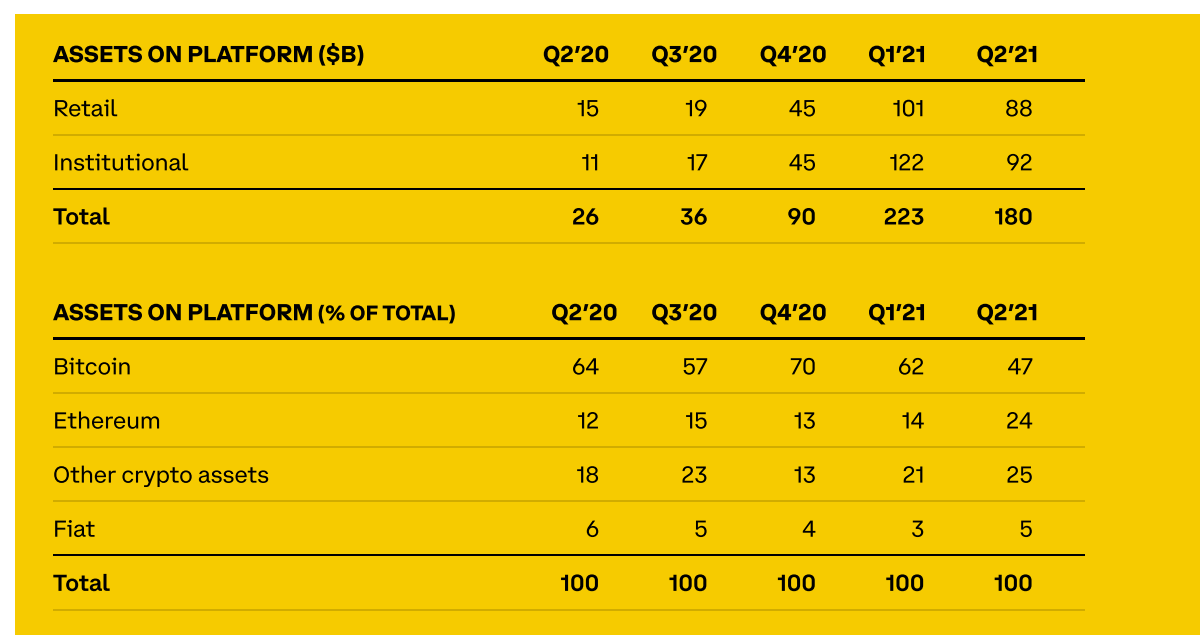
Source: Coinbase. Key metrics for assets on the Coinbase platform.
That said, one metric they haven’t published is the net cash invested/divested by customers. We can see their BTC, ETH, and other asset holdings, which they disclose were worth $223bn at the end of Q1. We know what happened to the BTC and ETH prices in Q2 and can guess a typical crypto.
Once you run the numbers, it seems there were negligible net cash inflows to Coinbase, which is perhaps what the stockmarket doesn’t like.
Summary
The question we won’t give up on is where is the money coming from? There are 898,600 BTC to mine before the next halving. At today’s price, that’s $42bn. Come on Coinbase, step it up.

