Bitcoin Network Demand Model Update

Disclaimer: Your capital is at risk. This is not investment advice.
Week 32 2021
No change this week as the strategy remains on 1/6.
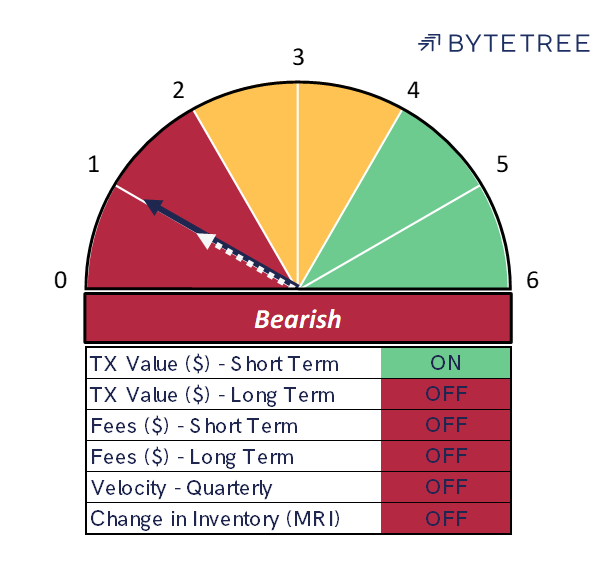
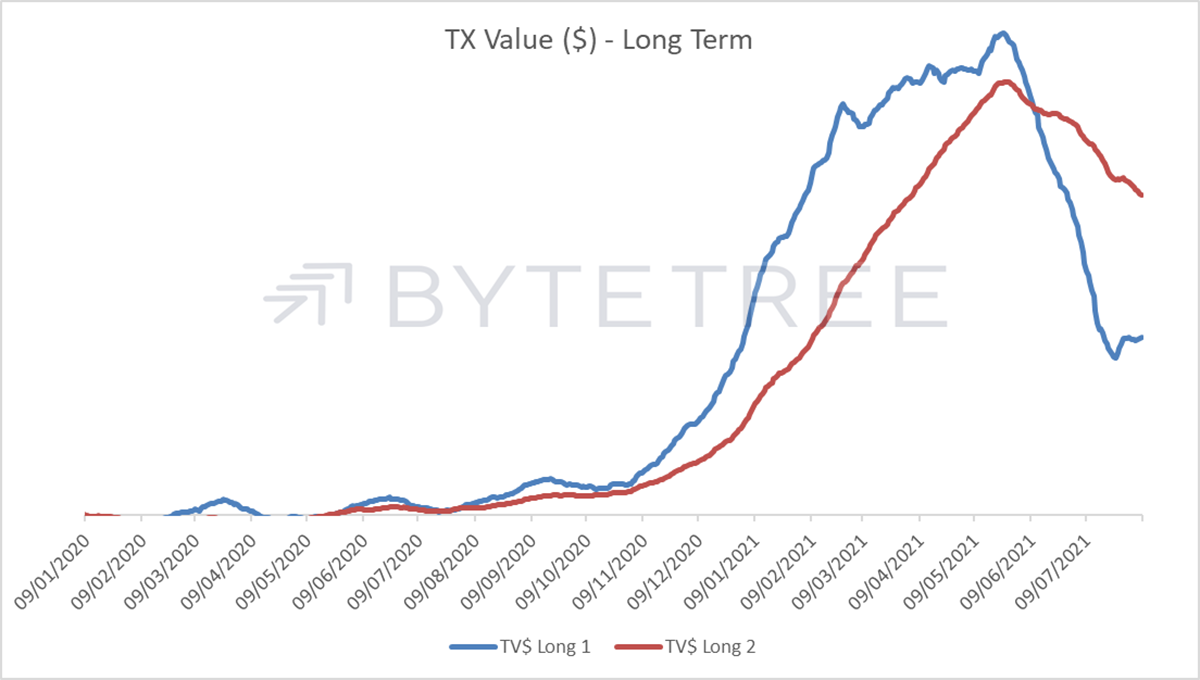
The short-term “spend” indicator continues to strengthen, suggesting that the longer-term indicator will duly follow suit, albeit that could be a month away from here.
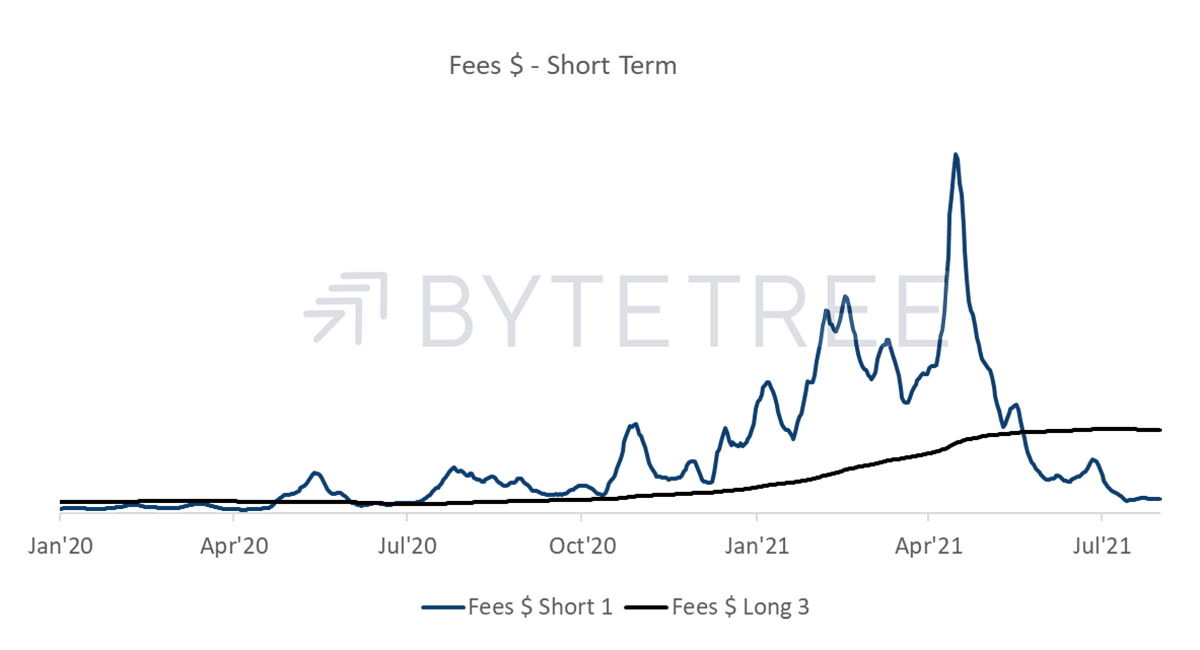
Meanwhile, the best that can be said for the fee-based signals is that they’re not getting worse. Short term fees are bottoming out as can be seen here, but the longer-term series will take time to turn.
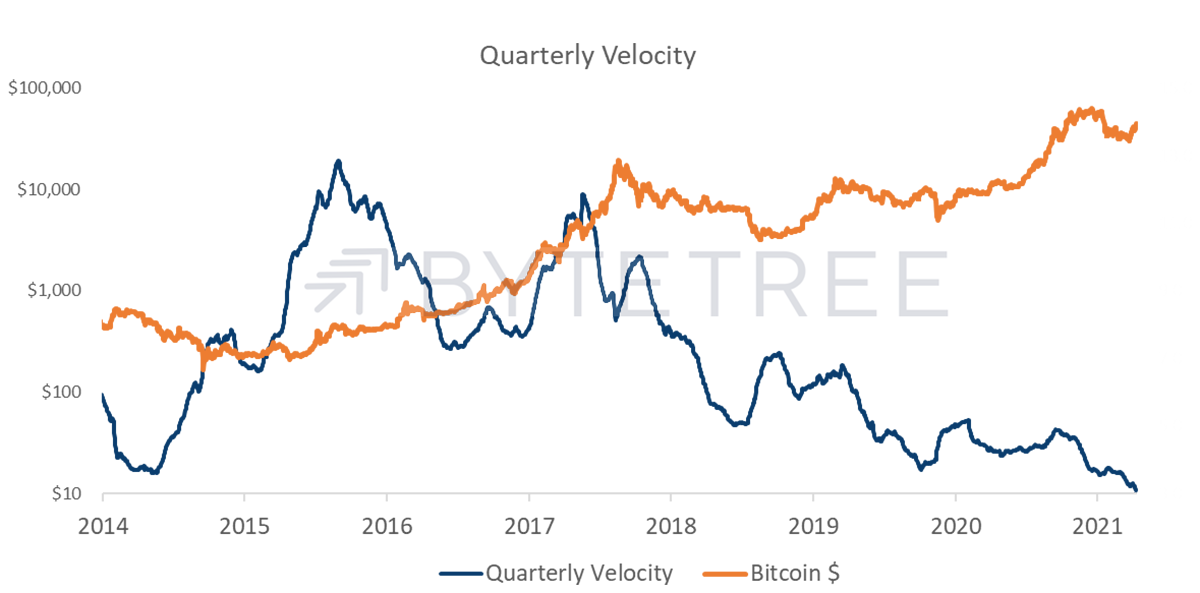
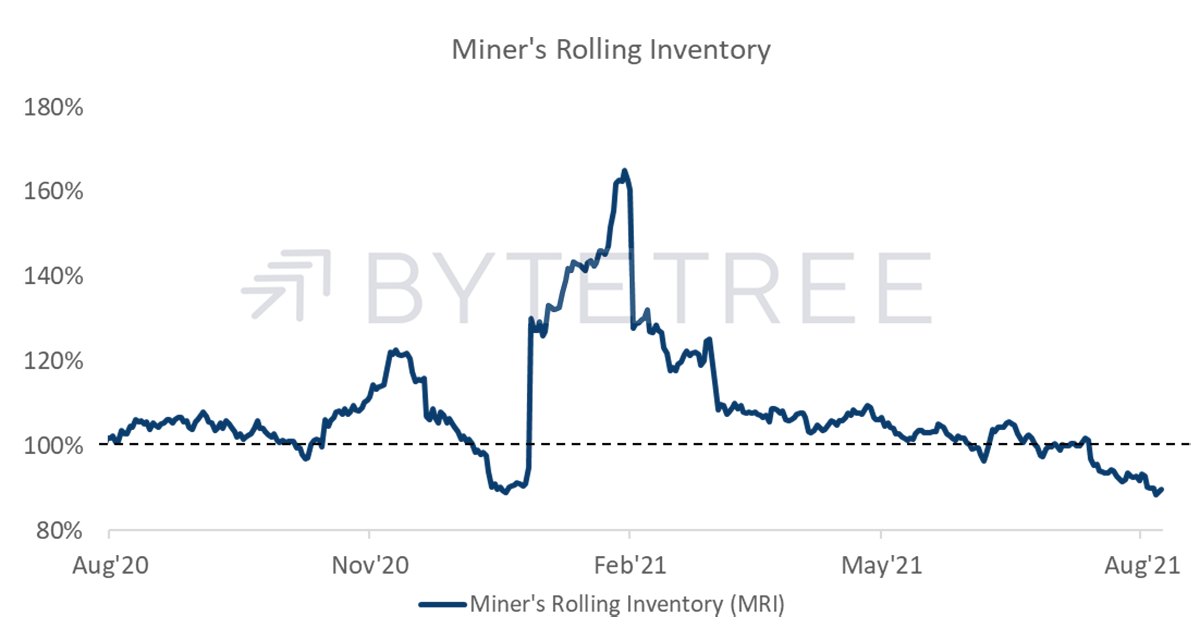
The velocity series and the mining series both remain depressed. If one was to try and extract positives, whenever the indicators have been this low historically, the price has been materially higher on a 2-year view. Indeed, the last time the inventory chart fell to this level was in December 2020 and what followed was a spectacular rally. The last time velocity was this low the bitcoin price was ~US$350.
Arguably, a reduction in trading volume and an unwillingness to sell inventory are the consequences of greater institutional involvement and greater HODLing discipline. It would, however, be good to see network activity corroborate a more bullish view.

Comments ()