Week 33 2021
The Network Demand Model remains at 1/6, with the sole positive signal being short-term transactions. Remarkably, even this metric has started to weaken again and it’s possible we could be back to 0/6 shortly.
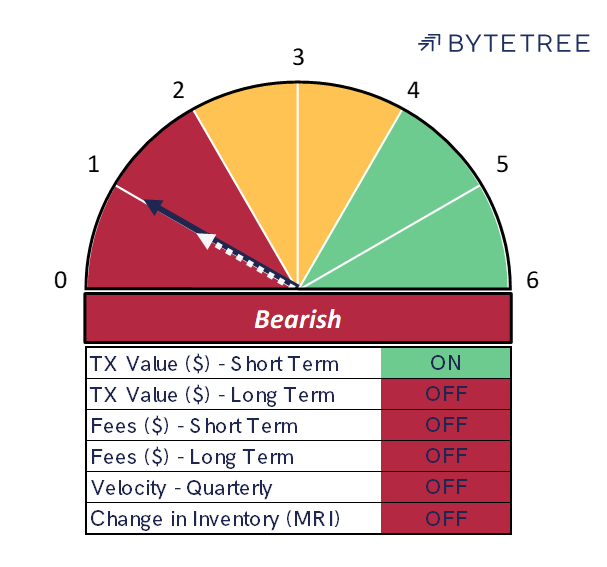
Short-term transaction signal
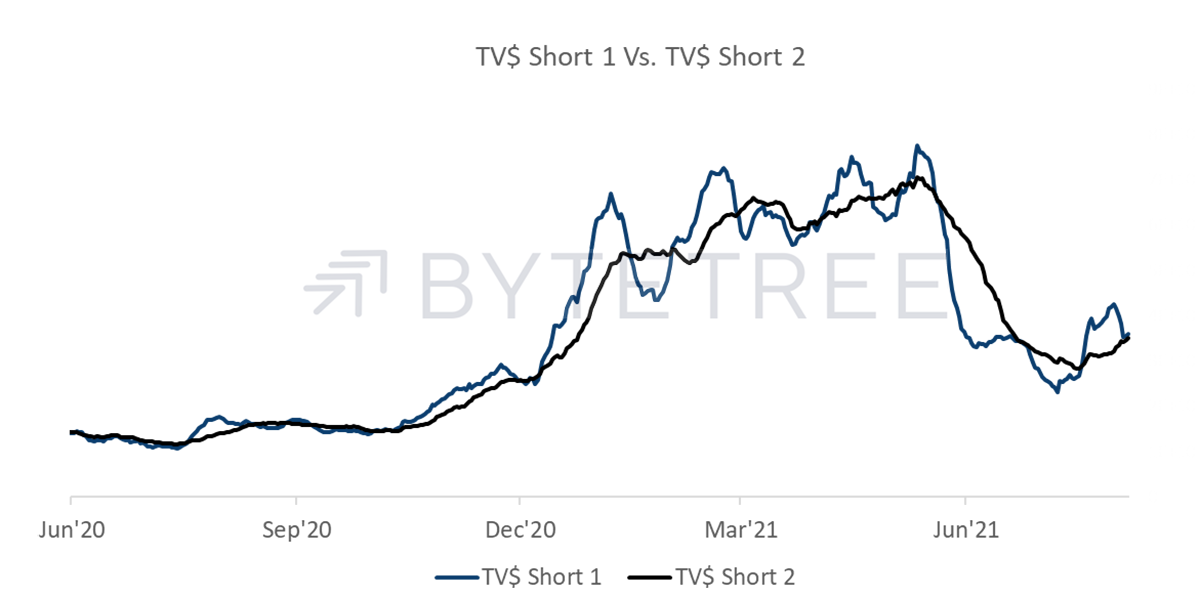
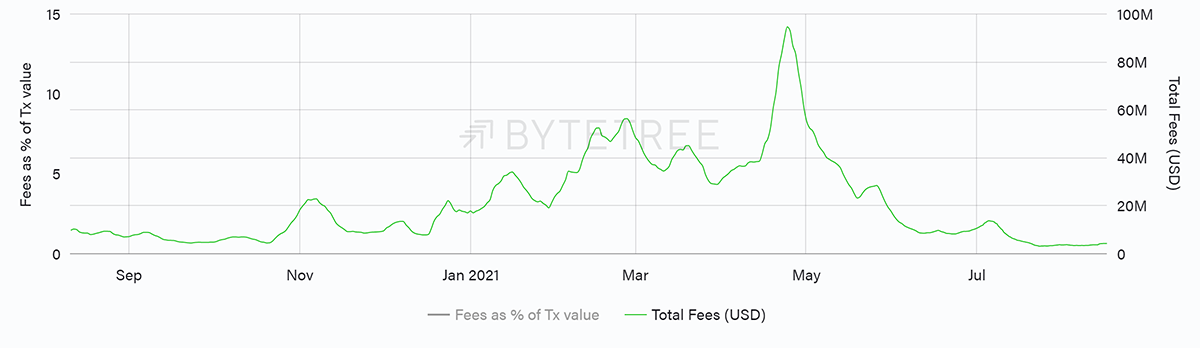
The better news is that Fees have perked up, probably on an account of the recent upward difficulty adjustment, whereby more energy - and hence cost - is now required to power the network. But it’s a small increase in a historical context (see charts over 1 week and 1 year below). As long as transaction numbers remain soft, we’ll probably see muted pressure for fees to go much higher, particularly as miners continue to come back online post the China crackdown.
Total fees over 1 week (LHS)
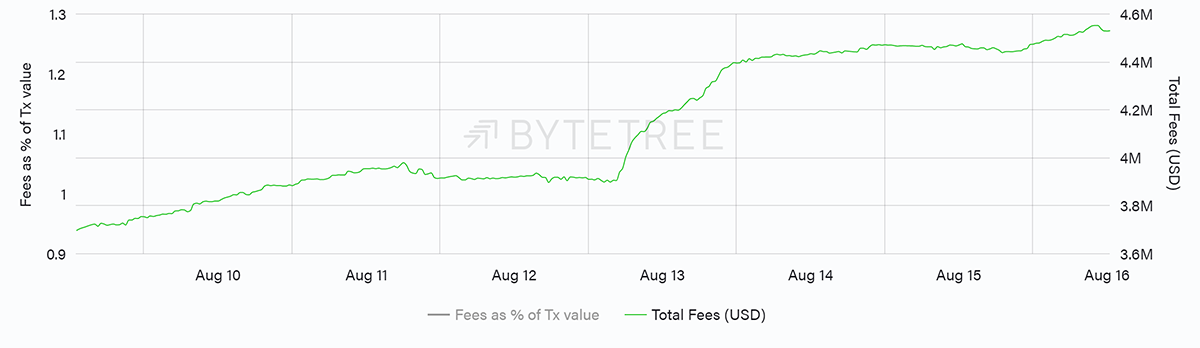
Total fees over 1 year (RHS)
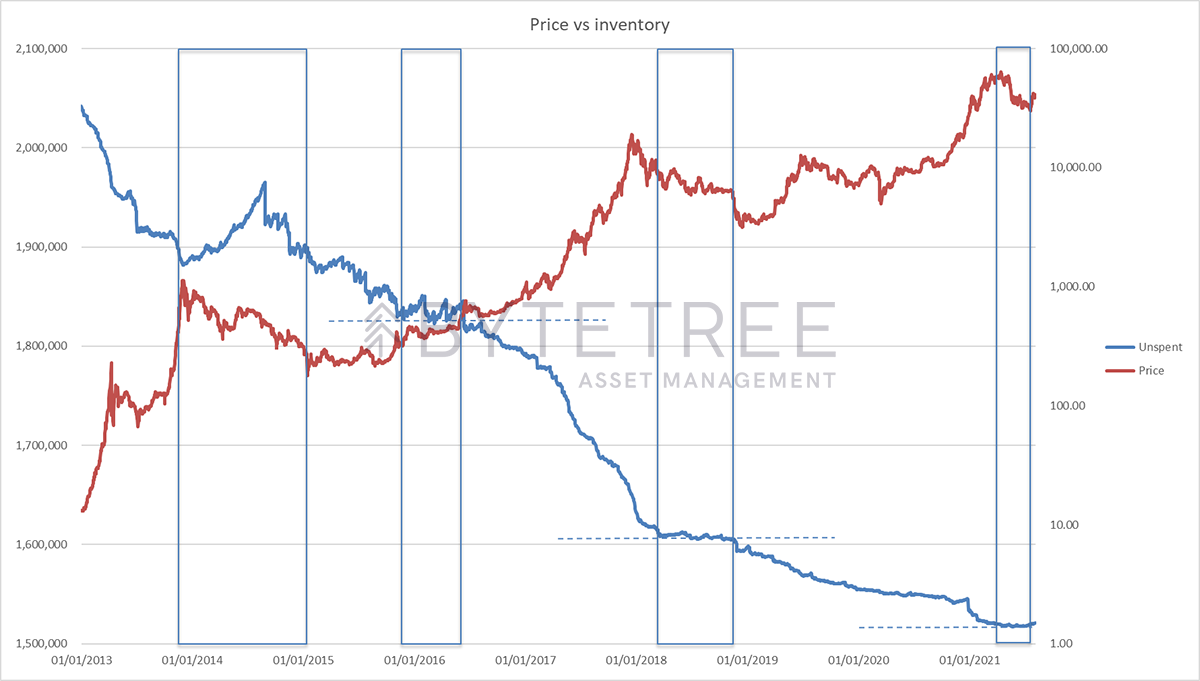
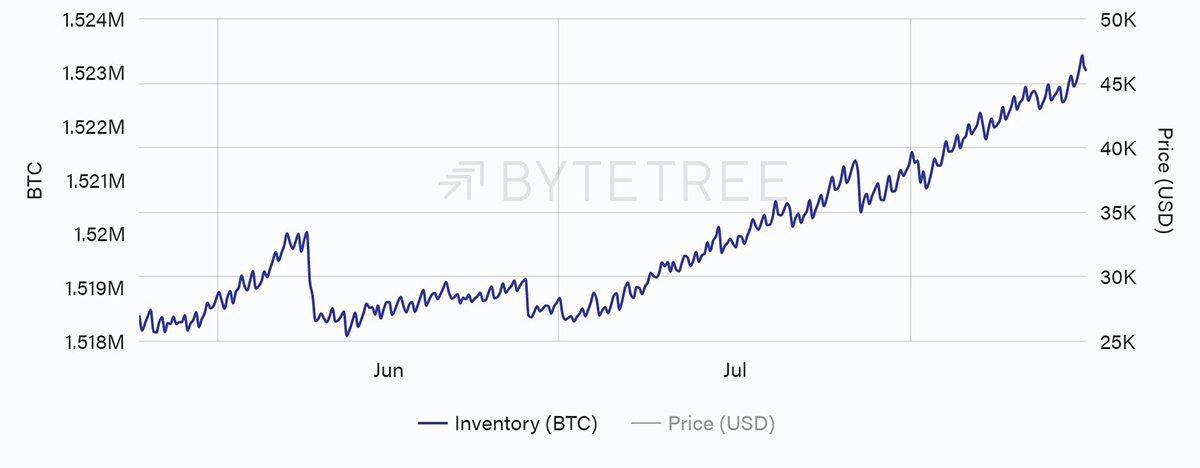
With this in mind, it will be fascinating to monitor how miners continue to manage their inventory. As with all commodity markets, a healthy network is generally one in which the miners sell straight to demand, as opposed to one in which they speculate on future price behaviour. At the moment the miners are building inventory, as can be seen in the following chart. In other words, they are speculating.
Inventory (BTC) – 12 weeks
This could be for several reasons:
a) They have visibility into a future price rise not available to the rest of the ecosystem
b) Costs are sufficiently low that they are able to afford the luxury of building inventory
c) There isn’t sufficient demand to maintain a supply/demand equilibrium without impairing the price.
Since no-one owns a functioning crystal ball, and it’s hard to decipher the demand picture beyond our already weak existing data. Let’s look at the second possibility.
Mining has been tremendously profitable recently, which makes it very tempting for miners to build bitcoin inventory. At what point, though, would they sell? As with so much in bitcoin, the answer is likely to be found in its pro-cyclicality (which is why it is so volatile). As long as the price drifts higher, and mining costs remain low, there is no compulsion to take profit. But if we continue to see upward adjustments in difficulty (and costs), and if the price starts to lose upward momentum, the pressure to cash in will increase. This becomes self-reinforcing, and the avalanche starts to fall. It is striking that if we look back in history, it is rare that the bitcoin price has remained in a bull market until unspent inventory has moved to new lows (see chart below).