Week 31 2021
During the week, the model’s short-term transaction value indicator turned back on. Despite that and a recent improvement in on-chain activity, the Network Demand model overall remains OFF, scoring 1/6.
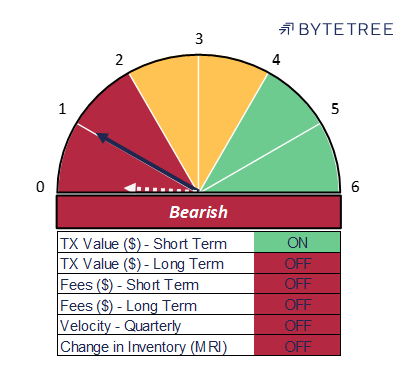
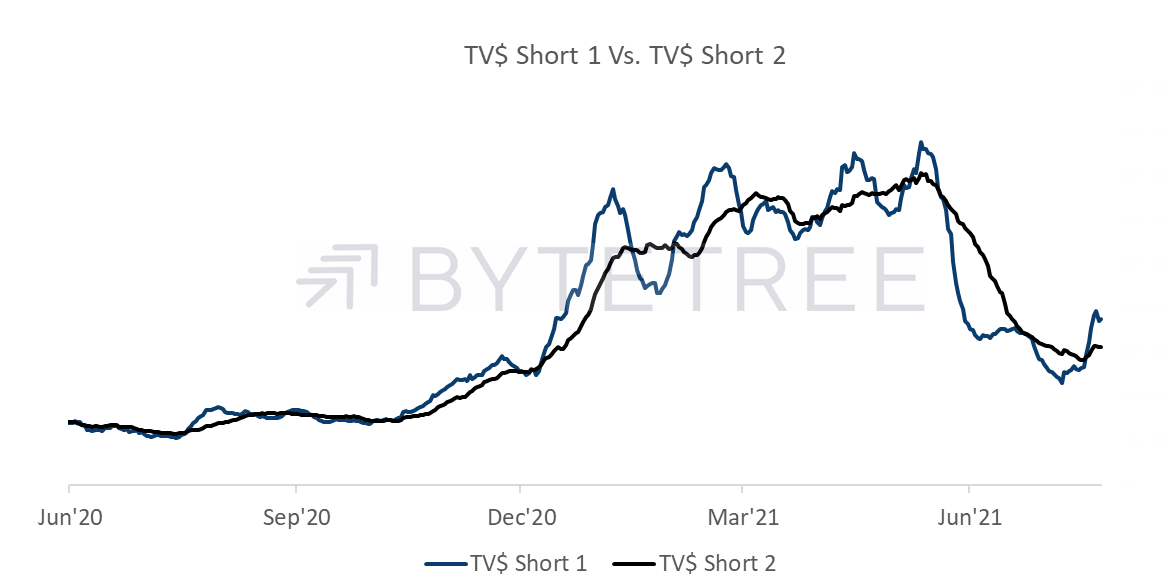
Over the last week there has been a sudden burst in activity, consistent with the price rise. This is reflected in the one BYTE metric back in positive territory, which reflects short term transaction activity (see Chart 1). The question now is whether this is sustainable. For the model to turn positive it requires a lot more evidence that this is the start of a trend and not an “event”.
Chart 1 – Short term transaction activity
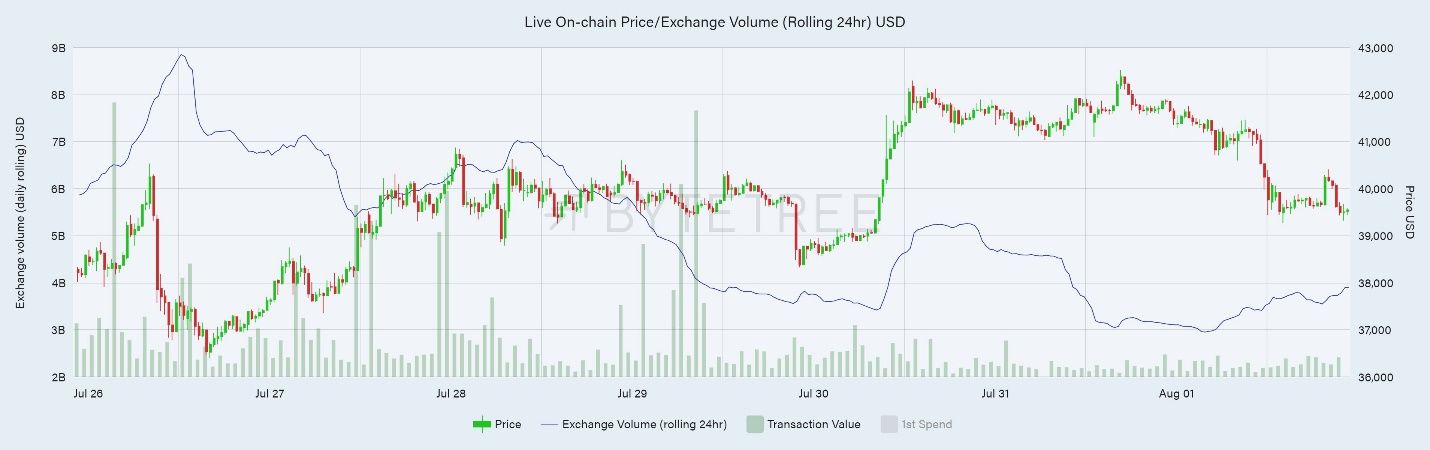
Total transaction value rose from just around US$25bn a week ago on a rolling 7-day average to around US$50bn at the close on the 1stAugust. To become more constructive, it will be important to see this sort of level maintained. The rise in 24-hour rolling exchange volumes(which can be seen in the “Reference” chart on the terminal) was even more marked, moving from the US$2-2.5bn range to peak at just under US$9bn on the 26th June. Exchange volumes now sit back at around US$4bn, while transaction value has also markedly calmed down, as per the chart below. This might serve as a signal that we have enjoyed the best of this rally already.
Chart 2 – Exchange volumes/Transaction values/Bitcoin price
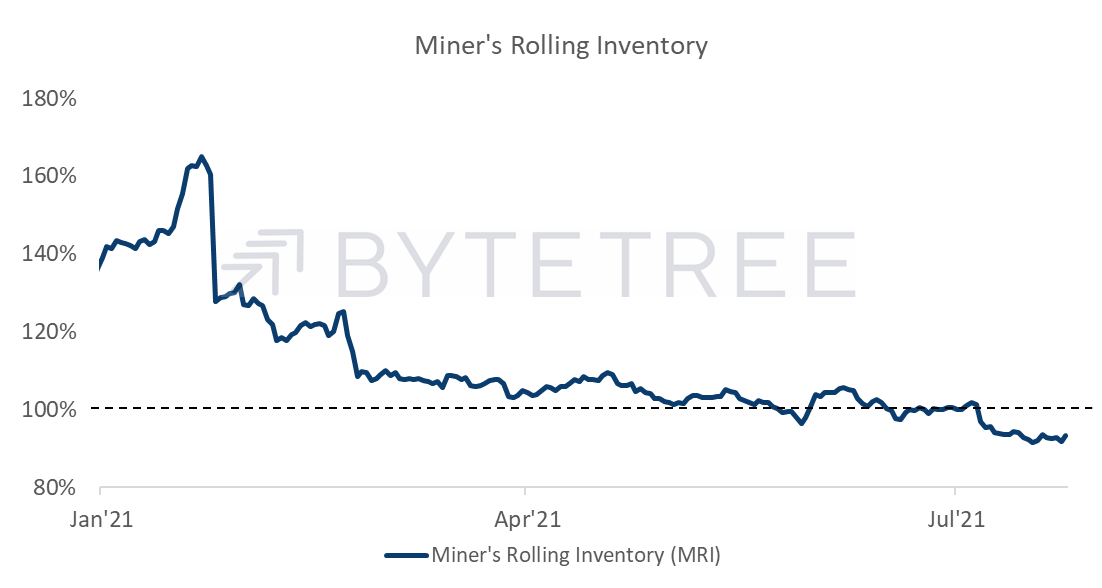
For the model to turn bullish we need to see a sustainable recovery in activity, not a burst of trading. Besides transaction activity, the data suggests that this is not yet the case. Both Miners’ Rolling Inventory (“MRI”) and the model’s Velocity measure remain subdued, although small but unconvincing ticks higher are observable.
Chart 3 – velocity remains low despite recent tick
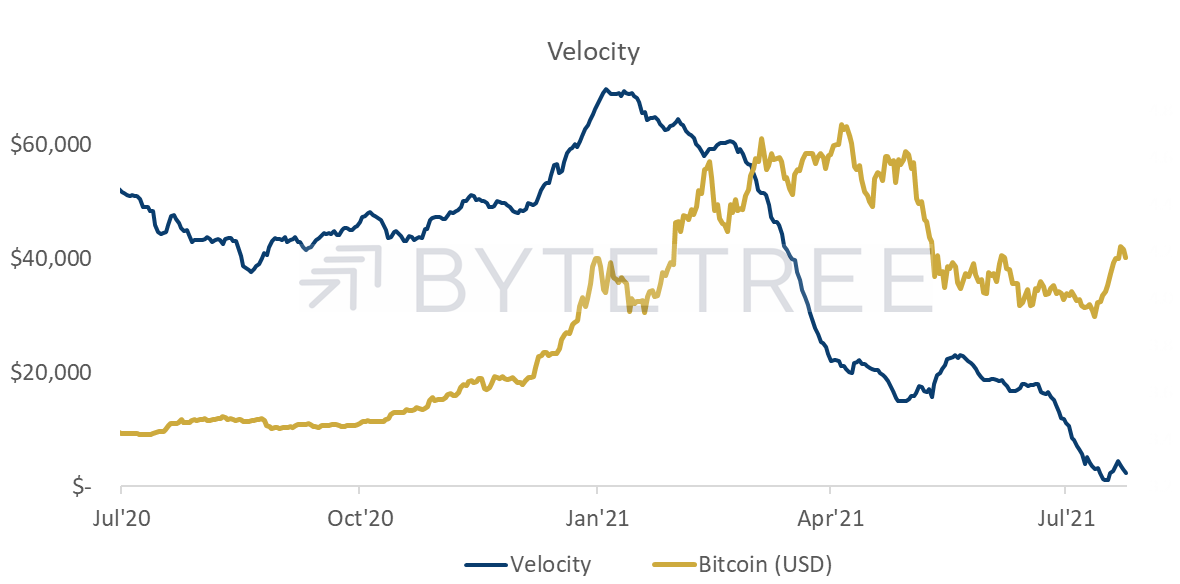
Chart 4 – MRI continues to suggest end demand is weak
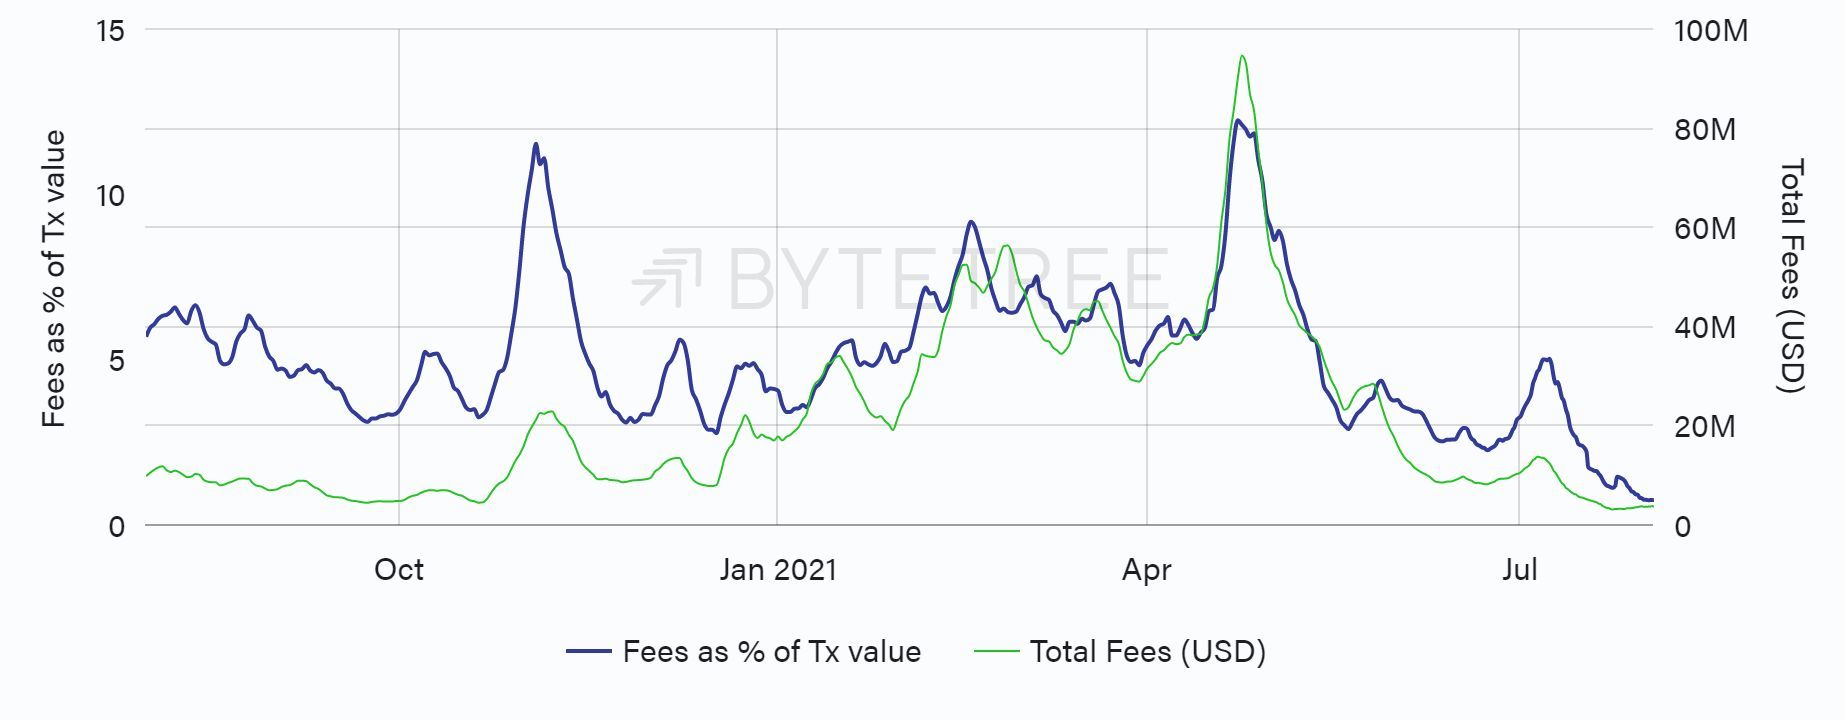
The most confusing piece of the puzzle remains the behaviour of Fees, which have historically been the most powerful indicator of network health. In aggregate they haven’t been this low since the 22nd October 2020, when the bitcoin price was just under US$13,000. Until we start to see a recovery here, the BYTE model will struggle to send a structurally bullish signal.
Chart 5 – fees have yet to show any sign of recovery
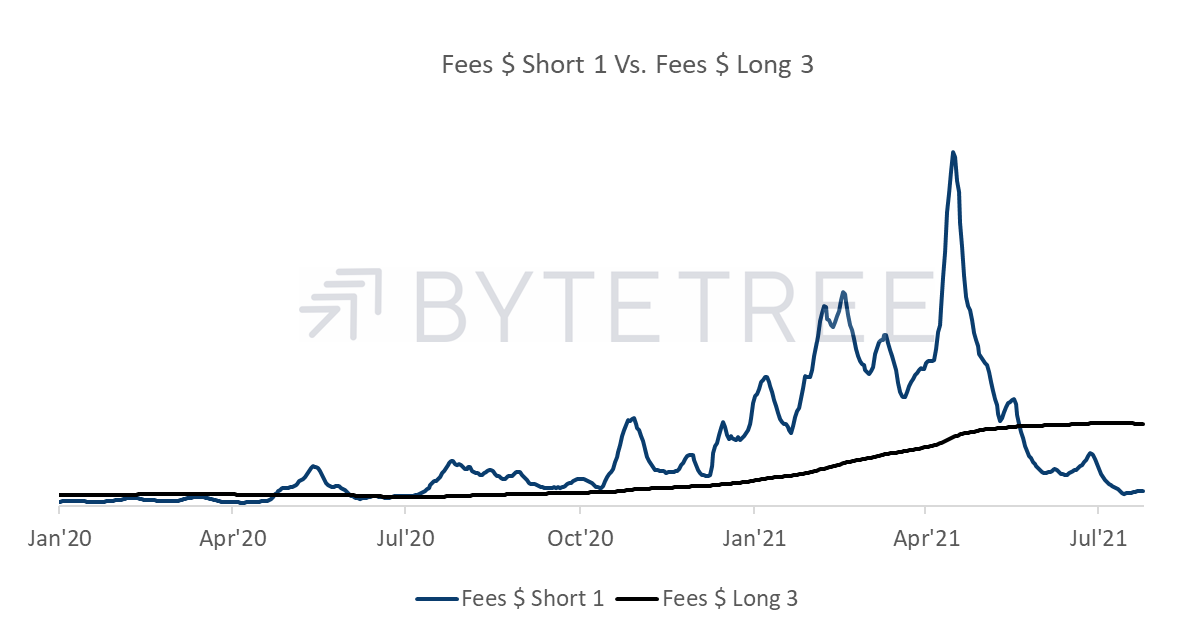
Chart 6 – total fees back where they were in Oct 2020