
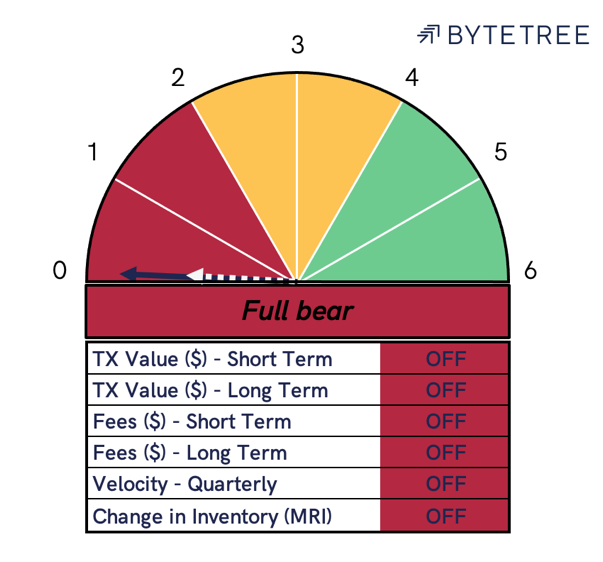
Week 28 2021
The Network Demand Model remains OFF this week, with price closing yesterday at $34,258. The price has been trading in a narrowing range between $32k - $36k over the last three weeks, as volatility falls back towards 90%.
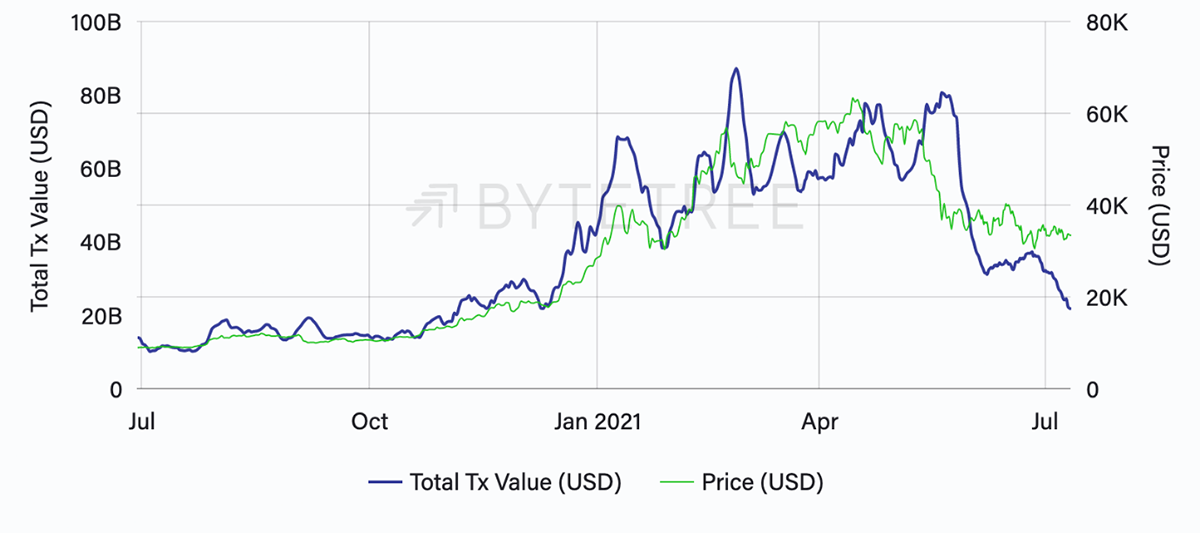
Starting with short term TV$, there has been a continued drop in activity on the Bitcoin Network. Last week we observed that TV$ was breaking below a support of $30Bn of traffic per week. This trend has continued, with just $22Bn transferred over the network in the last seven days.
Quarterly velocity has now broken through a historic base of around 360%. This is now the lowest velocity reading ever measured on the network.
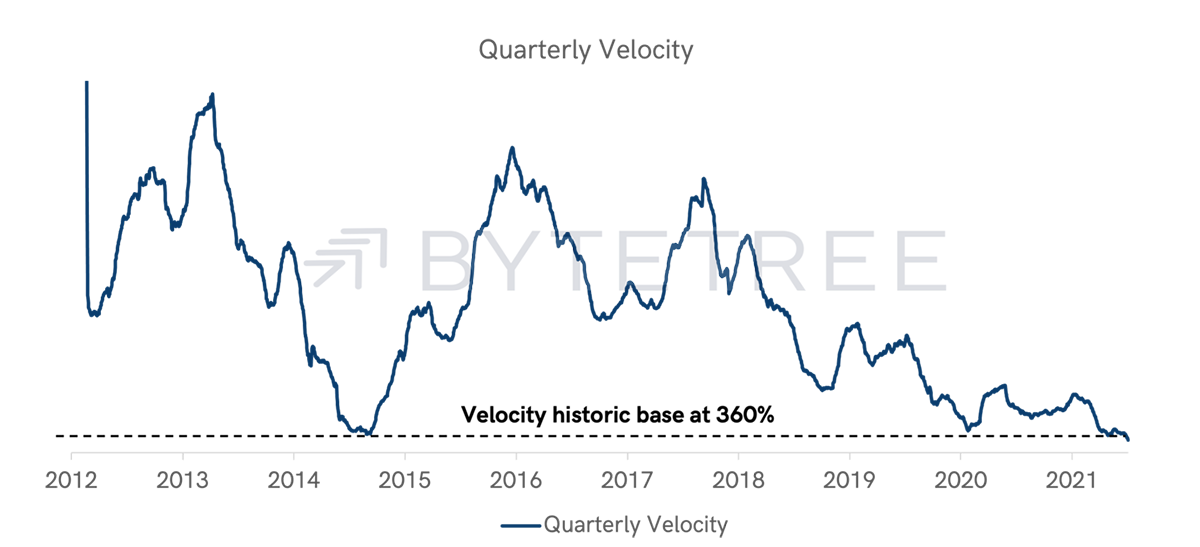
As the price of a bitcoin increases, it is logical that fewer bitcoins will be required to transfer the same amount of USD value traffic over the chain.
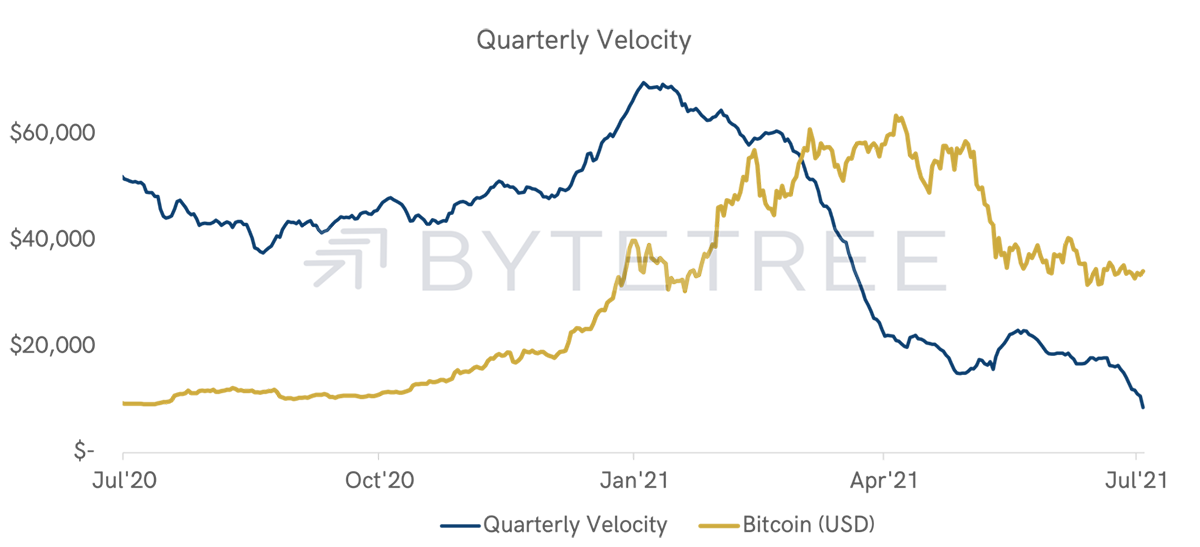
On this basis, the rate of change, or slope, of the velocity metric is a better indication of short-term network demand. Over the last 12 months, the rate of change of velocity has served as a leading indicator for bitcoin’s price.
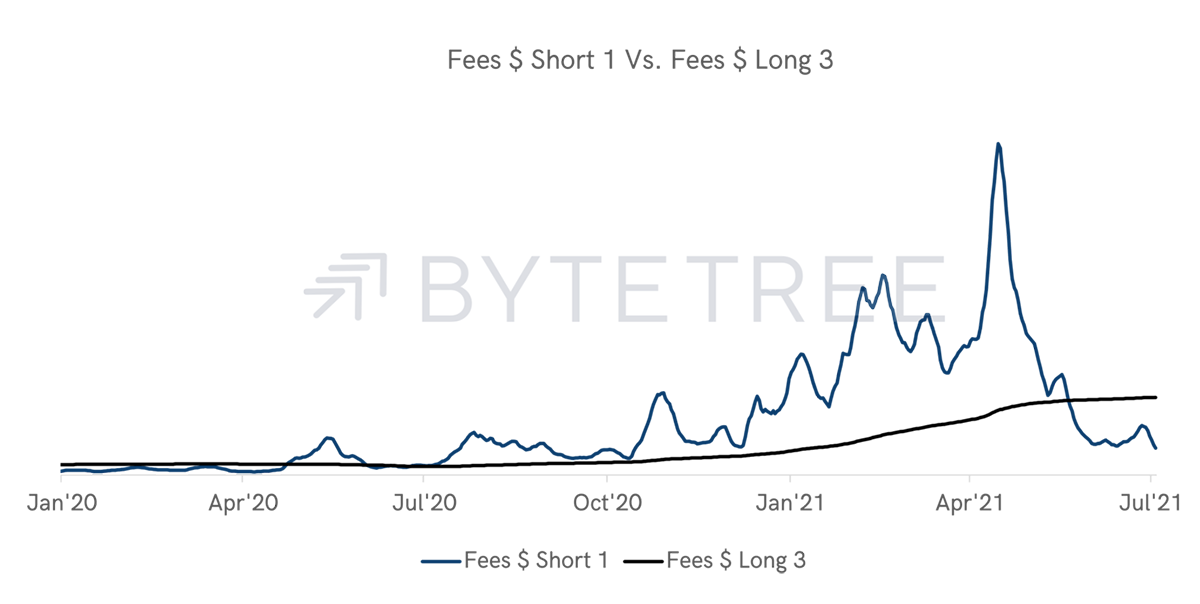
The support that fees were forming last week has also now been broken to the downside.
Last week, we commented that the significant difficulty adjustment on the network would increase throughput on the chain and relieve pressure on the mempool. As we had anticipated, this pattern played out and fees have subsequently fallen.
The final metric to observe today is the Miner’s Rolling Inventory (MRI). This measures the net inventory position of Bitcoin’s core infrastructure providers. Miners tend to sell inventory into a strong market and build up their position when the bid is weakening.
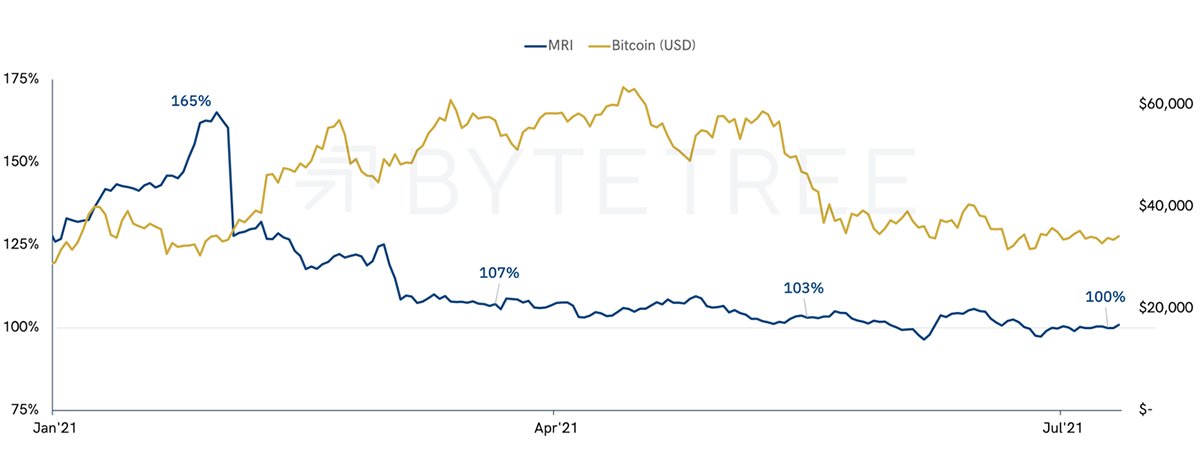
MRI, like velocity, is a non-price indicator. We can see that miners have been gradually building their inventory positions over the first half of this year. In June, MRI returned to 100% (net zero) when bitcoin first returned into the $30 - $40k range. It has continued to trend around zero over the last 6 weeks.
With network indicators continuing to deteriorate, price risk remains firmly to the downside. As such, the model remains 100% in cash after selling bitcoin on 2 June at $36,706.


