Week 24 2021
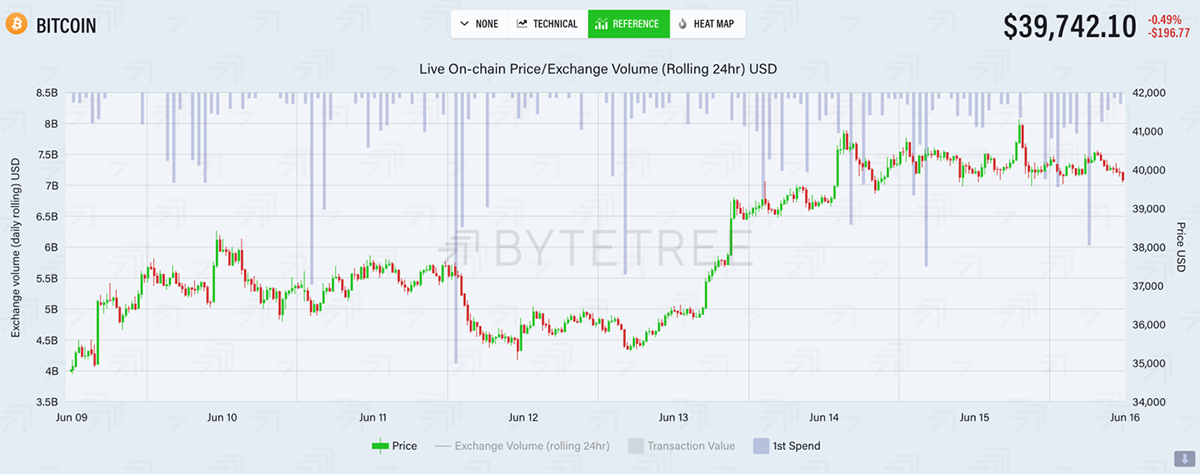
The Bitcoin network model moves to a “Full bear” this week with all indicators now “OFF”. Price has bounced from $33k to the $40k level as volatility has continues to rise to 112%. We view this as a short-term response triggered by Elon Musk’s encouraging words on bitcoin, along with MicroStrategy announcing a $1Bn share issuance to fund further bitcoin purchases.
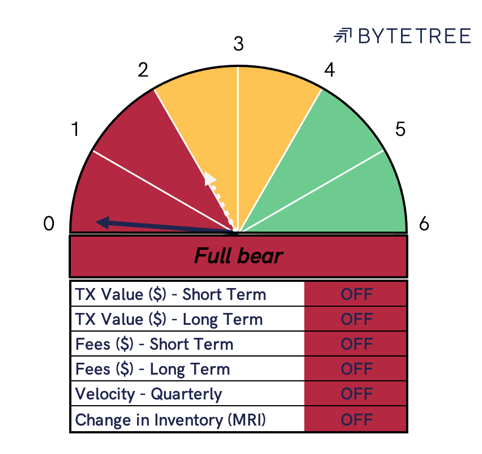
On-chain metrics have continued to deteriorate this week despite the rising price, notably transaction value $ and Fees $ on the long-term have now both switched to “OFF”.
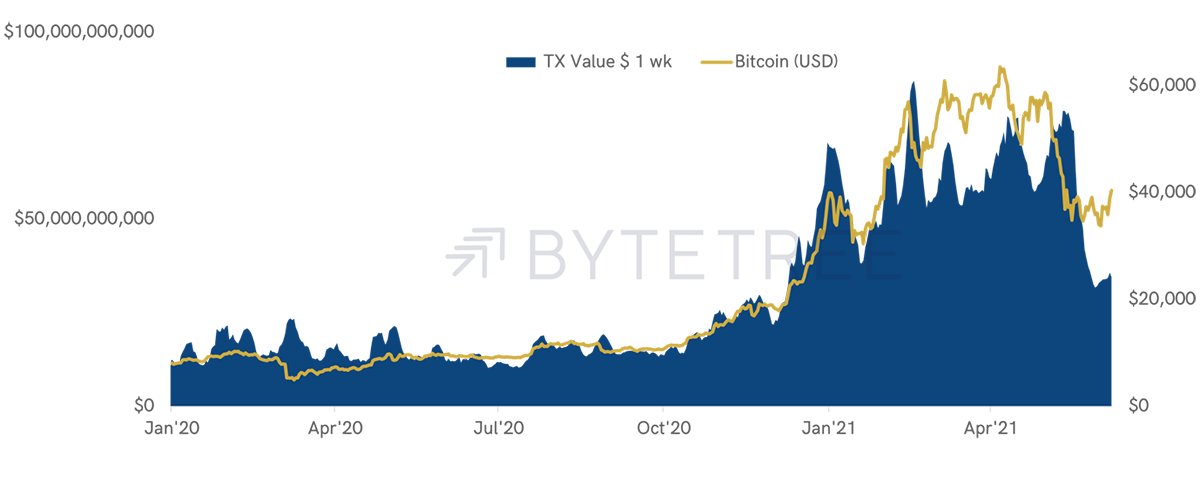
Transaction Value ($) this week remains below the levels of the first half of this year. While this is partly attributable to a fall in bitcoin’s $ value, overall network velocity has also fallen. This is indicative of fewer bitcoin moving through the Bitcoin Network.
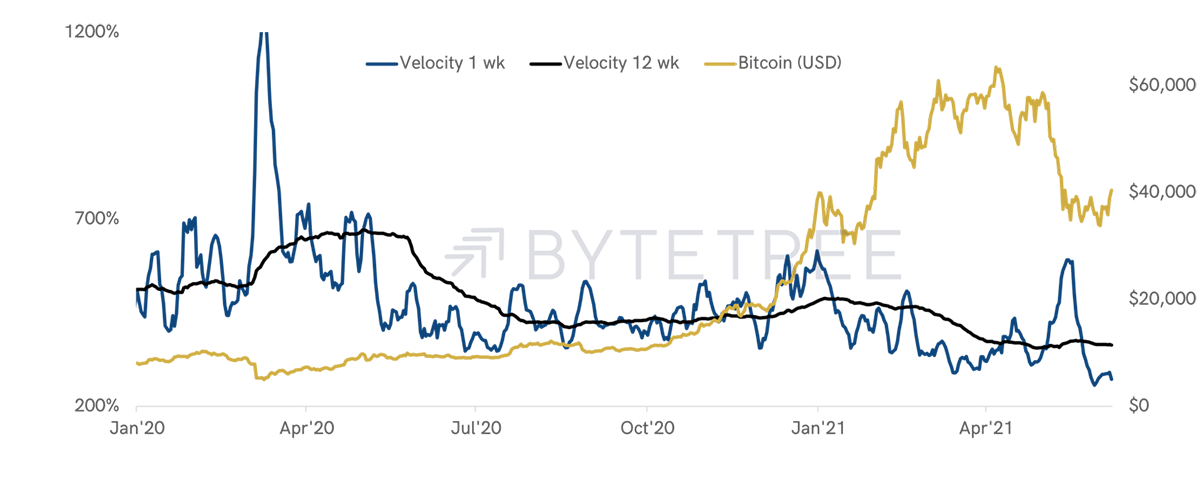
Weekly velocity spiked in May’21 with a flurry of activity as the price of bitcoin fell from $60k to the $30k region. This has not been sustained over the last week, seen by the blue line turning down to the right-hand side of the chart. Weekly velocity now sits at 260%, a level last seen in 2014 when bitcoin traded at $600.
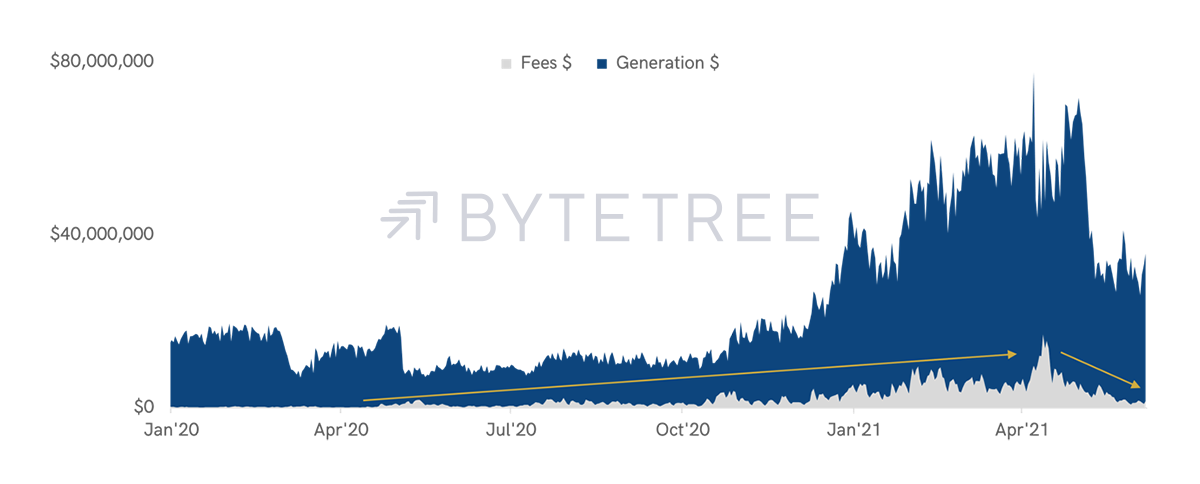
Network Fees, a core indicator of network demand, have continued to fall this week. Fees currently sit around $1.3M per day, down from $10M+ per day during the strong price growth earlier this year. The daily revenue generated by new coins awarded to miners has also fallen sharply. This is due to a fall in the price of bitcoin, as well as block times slowing down.
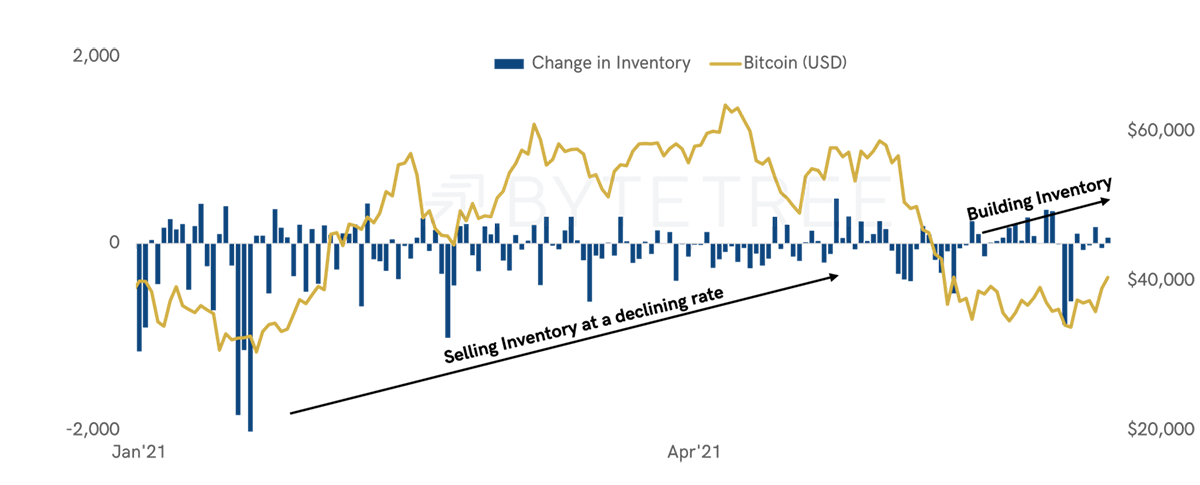
Miner’s Rolling Inventory (MRI) is also “OFF”, as miners continue to consolidate their inventory. This means that they are now building an inventory position, having run off their excess bitcoin during the first half of this year. Miners typically sell into a stronger market and build inventory during price weakness. In some cases, however, miners may react to short-term price volatility. In these times, their selling exacerbates a falling price, adding excess supply into the market.
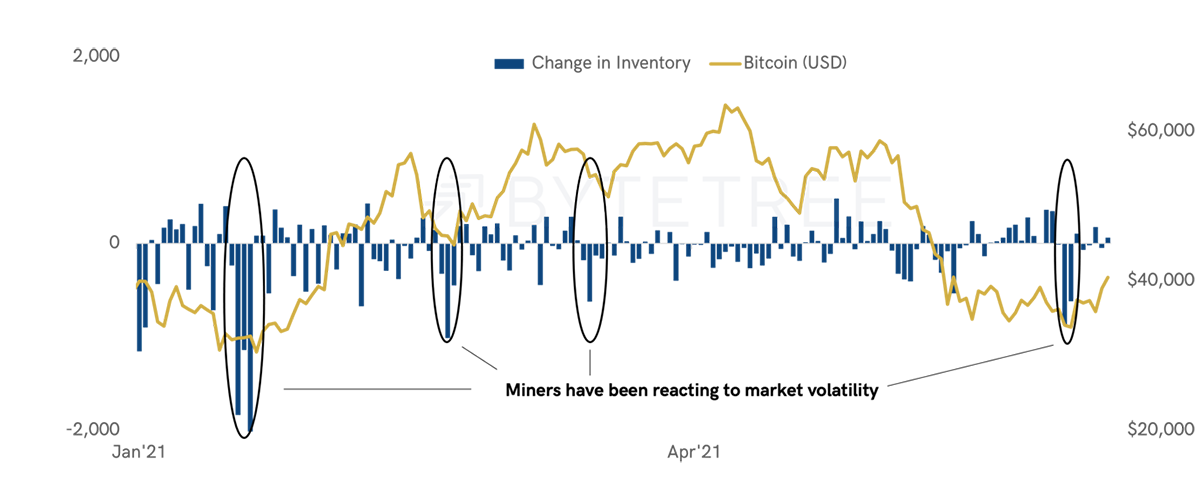
The chart above highlights four instances over the past six months where miners have dumped their inventory in response to a falling price. Once the selling subsides, price can recover. Therefore, the MRI metric has two applications over both short and long-term time frames.
A rising MRI on a long-term time frame signals a stronger market, whereas a spike in MRI (net selling) within a day is indicative of a further fall in price. The best way to observe a short-term rise in miner selling is under the “Reference” tab in the charting section of the ByteTree Terminal (see below).