
Week 23 2021
The Bitcoin Network Demand Model remains on a 2/6, with the price of bitcoin falling by 8% since we indicated the network had turned bearish last week.
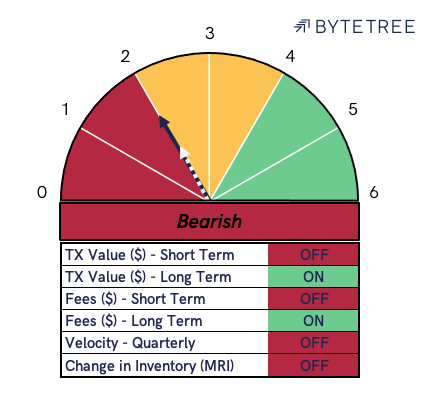
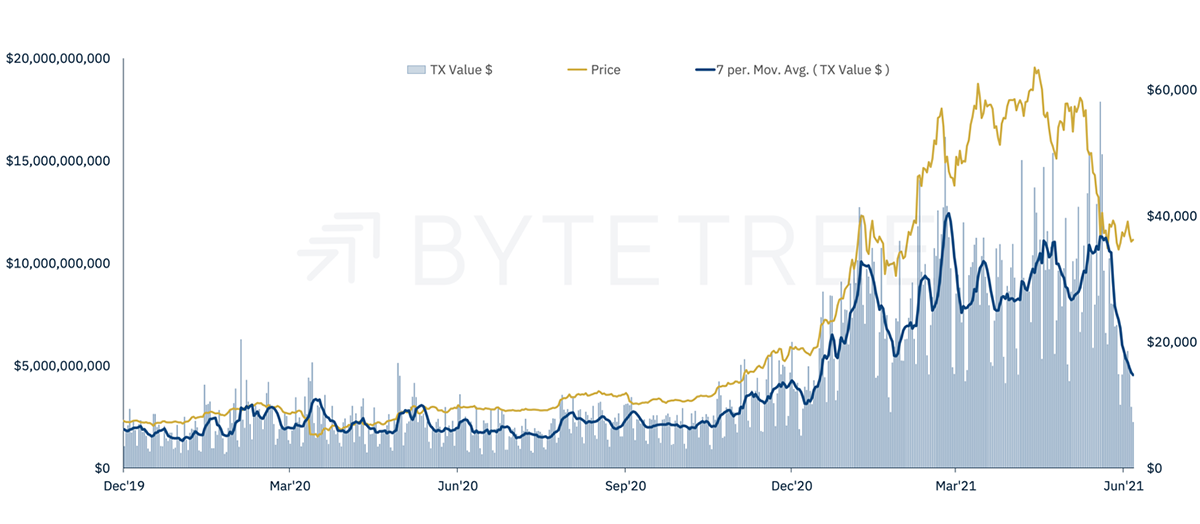
On-chain transaction value (TV$), shown in blue below, has continued to fall sharply and settled less than $5Bn per day over the week. This marks a further 17% fall from last week and will likely drive the long-term TV $ indicator to “OFF” within the next week.
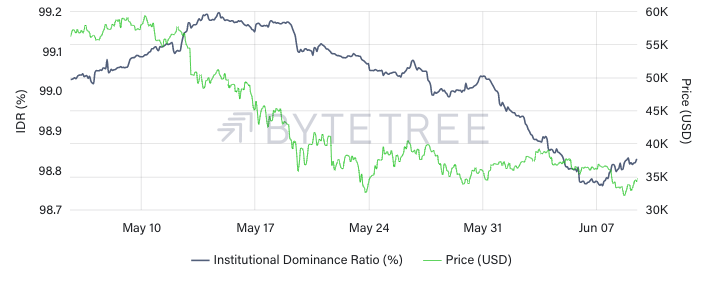
A significant driver of falling TV$ is the lower institutional participation rate, measured on the Terminal through our Institutional Dominance Ratio (IDR). IDR has steadily fallen since mid-May, accompanied by outflows of 8k BTC from institutional-facing investment vehicles, as measured through our fund-flows data.
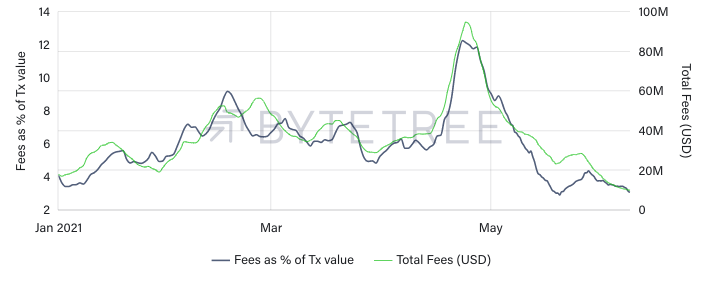
Fees (USD) have continued to fall and remain “OFF” on the short-term time frame. The longer-term trend remains “ON”; however, the rate of change is negative and accelerating. Fees (USD) in absolute terms have returned to Jan’21 levels.
Today’s news about El Salvador’s Congress recognising bitcoin as legal tenderis undoubtedly positive for the long-term outlook of the Bitcoin Network. However, the BYTE model does not seek to comment on the long-term feasibility or success of the network, instead focusing on the current level of activity taking place.
While we are optimistic that El Salvador and its citizens’ use of Bitcoin will boost overall network demand, we wait for confirmation from the chain. On-chain data cuts through expectations of future value, as well as the hyperbole of “to the moon” and “laser eyes to 100k”, to focus on the utility here and now.


