Bitcoin Network Demand Model Update

Disclaimer: Your capital is at risk. This is not investment advice.
Week 21 2021
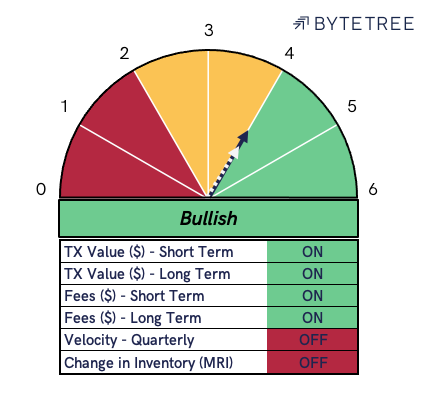
The Bitcoin network demand model remains unchanged this week on a 4. The price of bitcoin closed yesterday at $38k after a turbulent week, which saw volatility rise sharply to 114%.
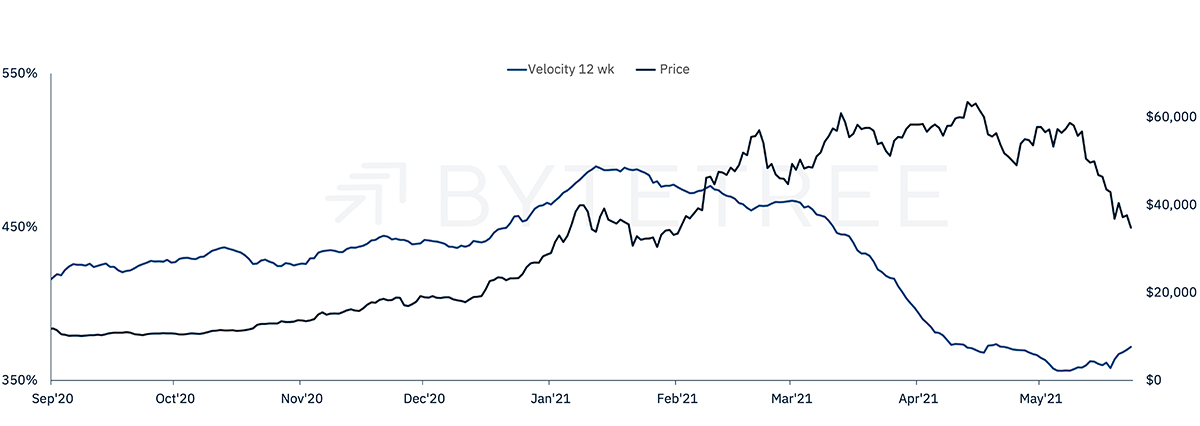
The 11% fall in price sparked a surge in on-chain activity in BTC terms, reversing the long-term downward trend for TV measure in BTC (velocity). Quarterly velocity currently sits at 372%, an increase of 16% from its 6 May’21 low point.
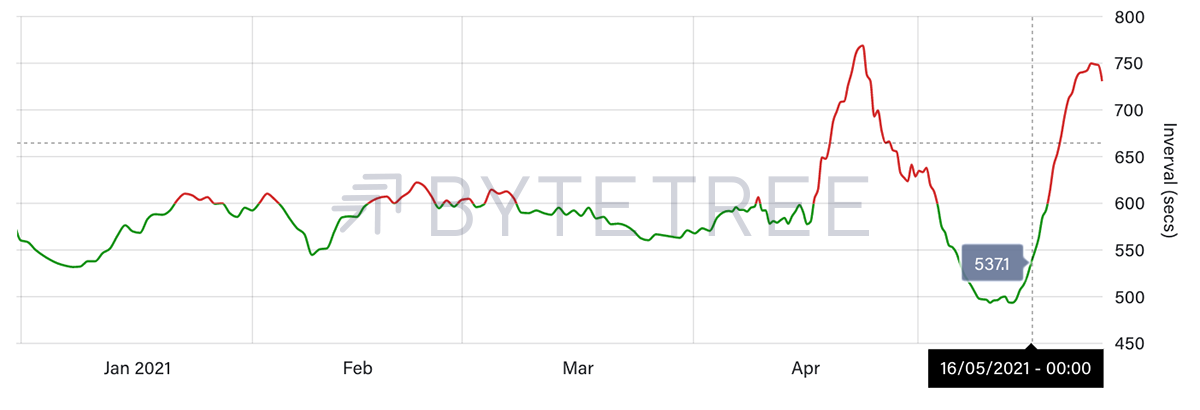
Short-term fees came very close to switching off this week, before the news on the 21 May that Bitcoin mining was to be banned in China. This news led to a sharp decline in hashrate on the network and a rise in the average block times up to 750 seconds. This is the second time in two months that we have experienced a sharp drop in hashpower, both times owing to exogenous events in China; the first being a power outage in mid-April.
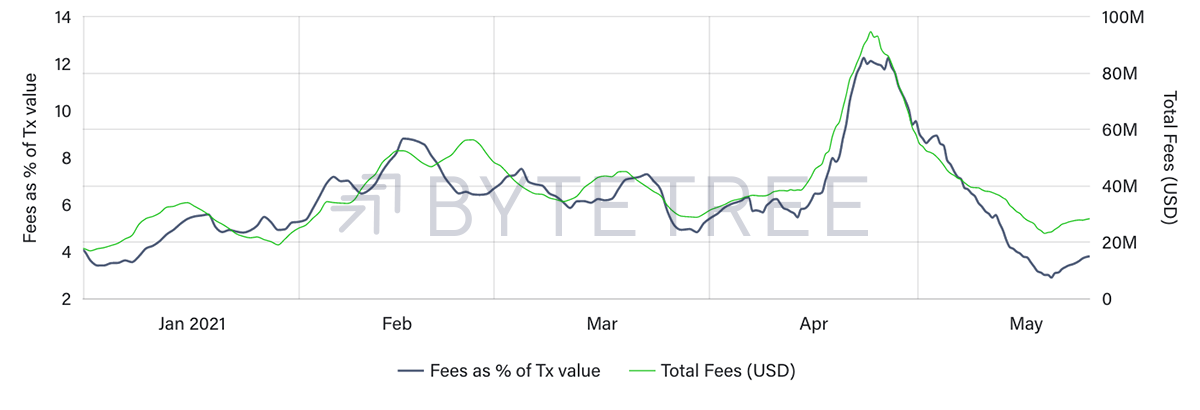
Fees did pick up marginally in response to lower throughput. This was enough to retain the short-term signal “ON” for this week, but not indicative of a resurgence in network demand.
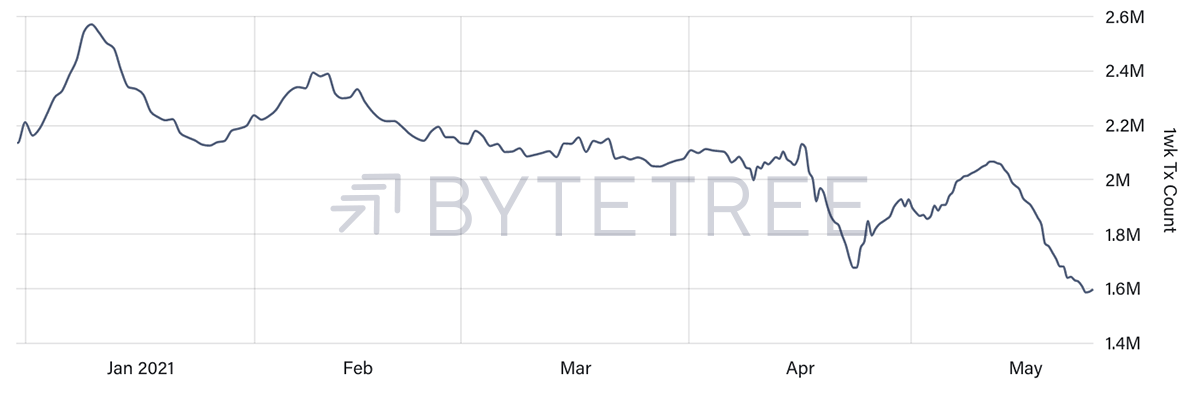
The lacklustre network demand, measured by transaction count, is evident on the chart below. Total throughput fell by 9% this week to just 2.7 TPS, marking a 12-month low of 1.6M transactions per week.