Week 20 2021
The Bitcoin network demand model moves back to a 4 this week after a sharp increase in on-chain settlement value (TV$) moves short term spend back to ON.
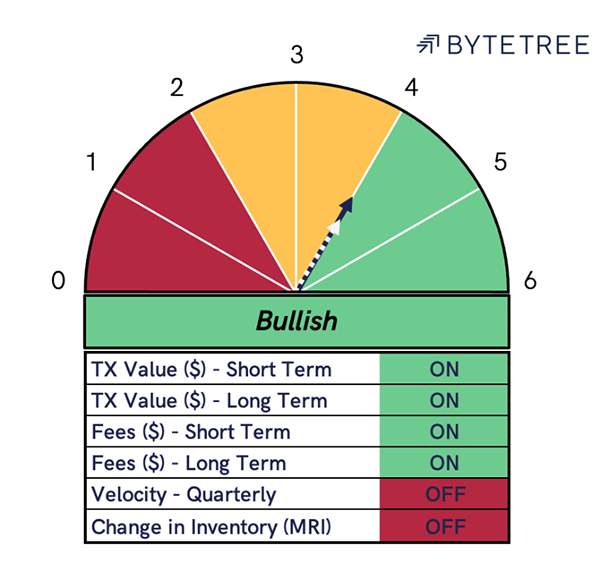
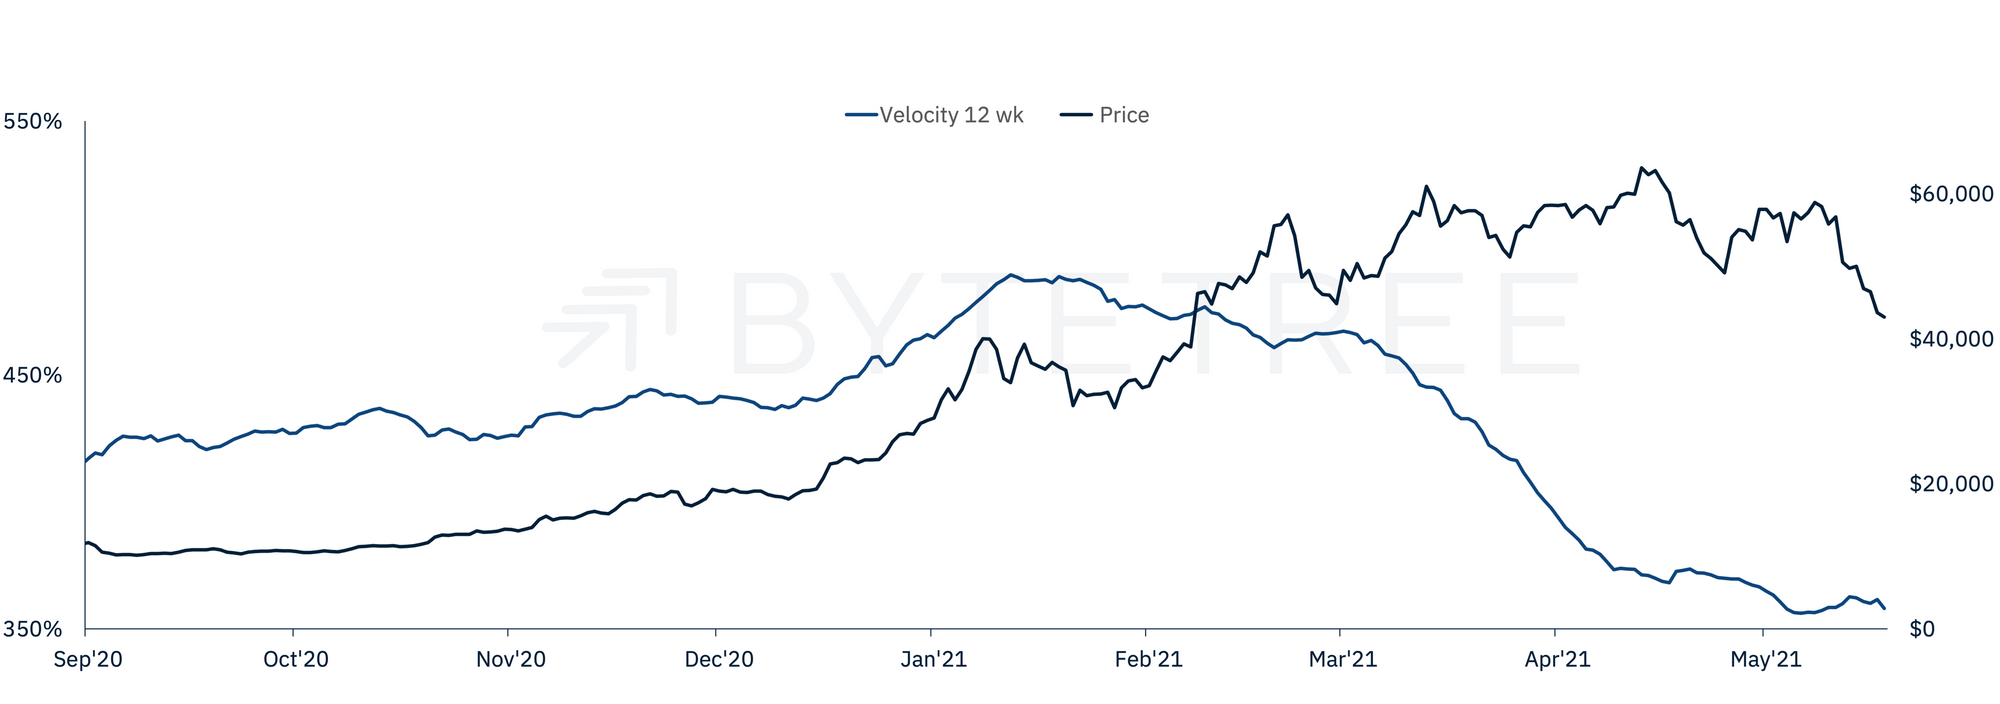
TV$ is up by 12% to 10. 7Bn per day, despite a 24% fall in the price of Bitcoin over the week. The divergence between price and TV$ signals an uptick in short term velocity. However, velocity’s decline over the past quarter means the signal remains OFF. The chart below shows how network velocity has behaved over the last 8 months. Following a steady rise through late 2020, the number of coins circulating in the economy has dropped steadily through 2021.
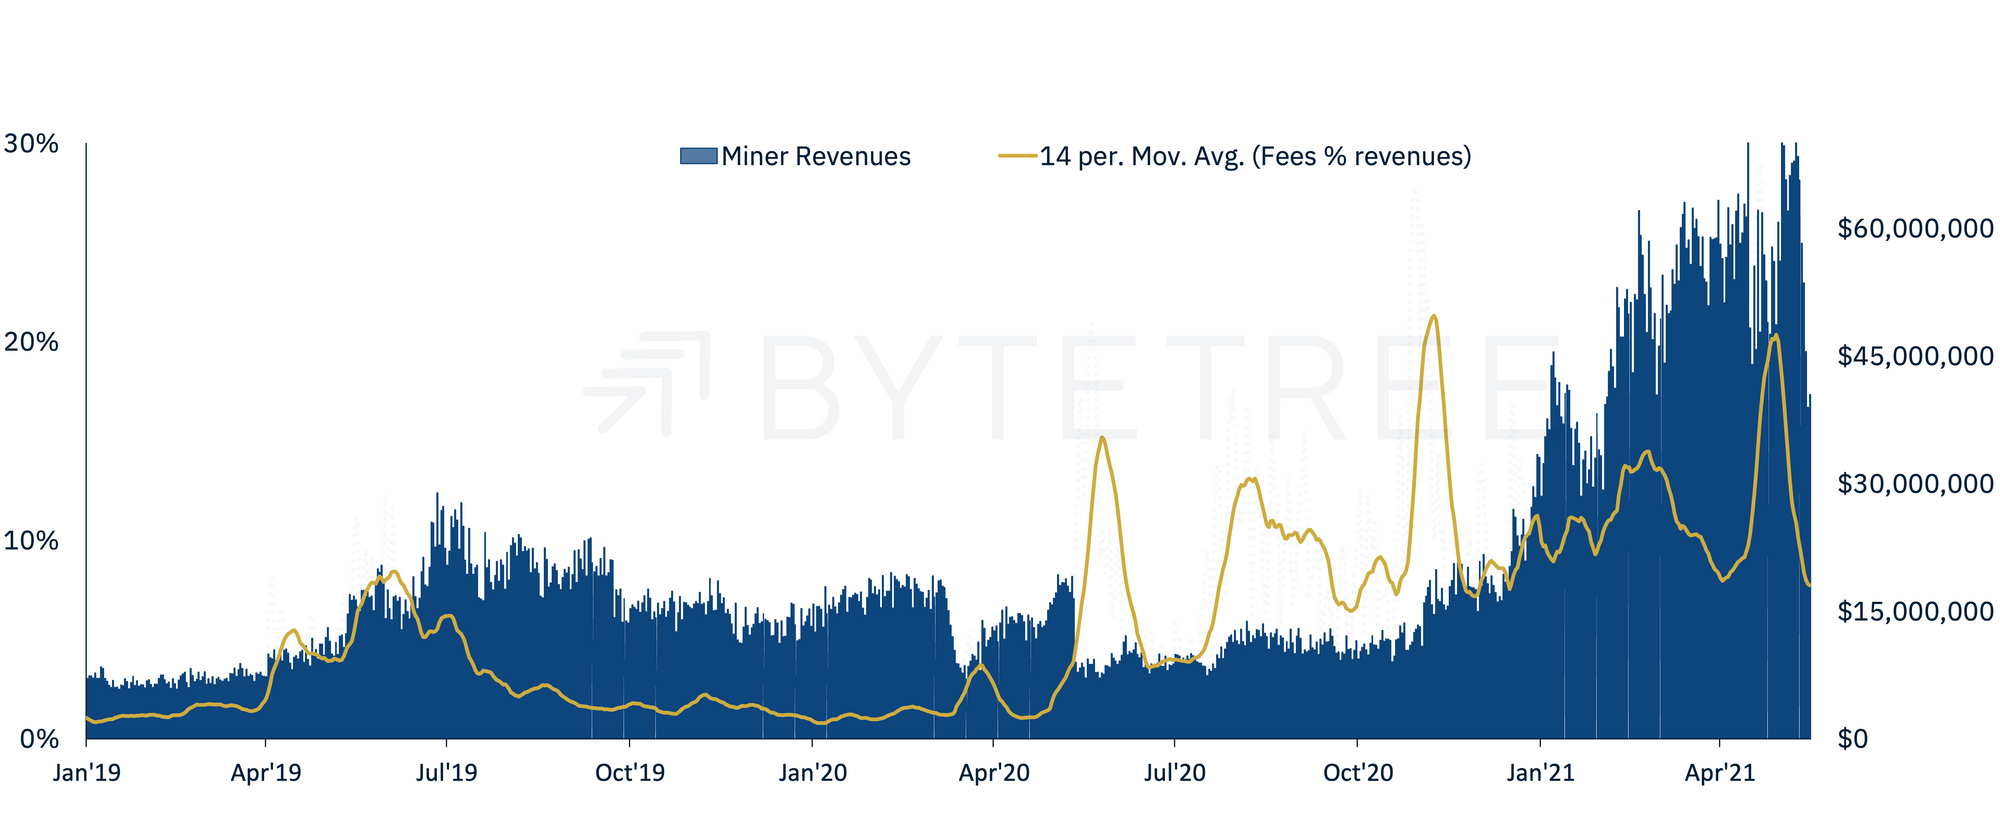
Long- and short-term fees remain ON, however the rate of change is steep and downwards. Should this trend continue then we anticipate that short term fees will turn OFF within the coming week. While miner revenues remain above $50M per day, the proportion attributable to fees has returned to the sub 8% level, last experienced in Q4’20.