Week 19 2021
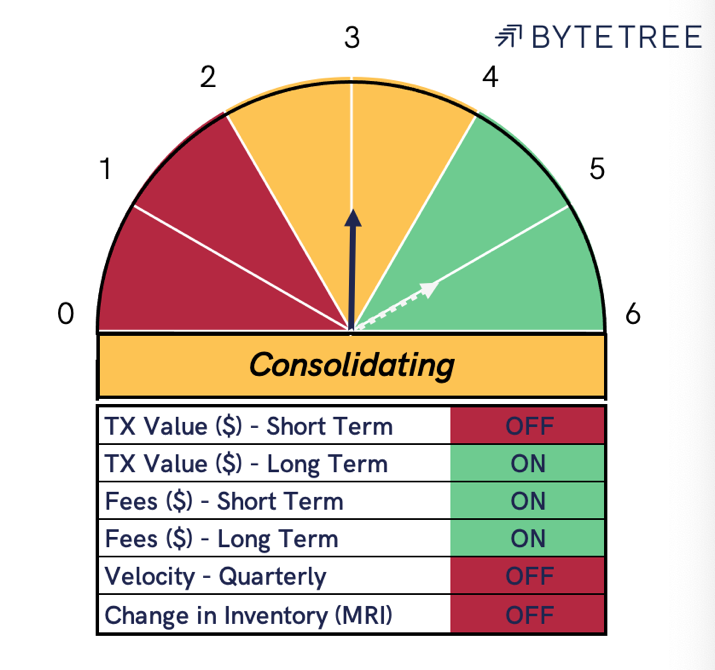
Bitcoin Network Demand continues to consolidate this week, slipping down to a 3 on the BYTE model. Historically, a 3/6 has signalled a more cautious approach to position size but remains invested.
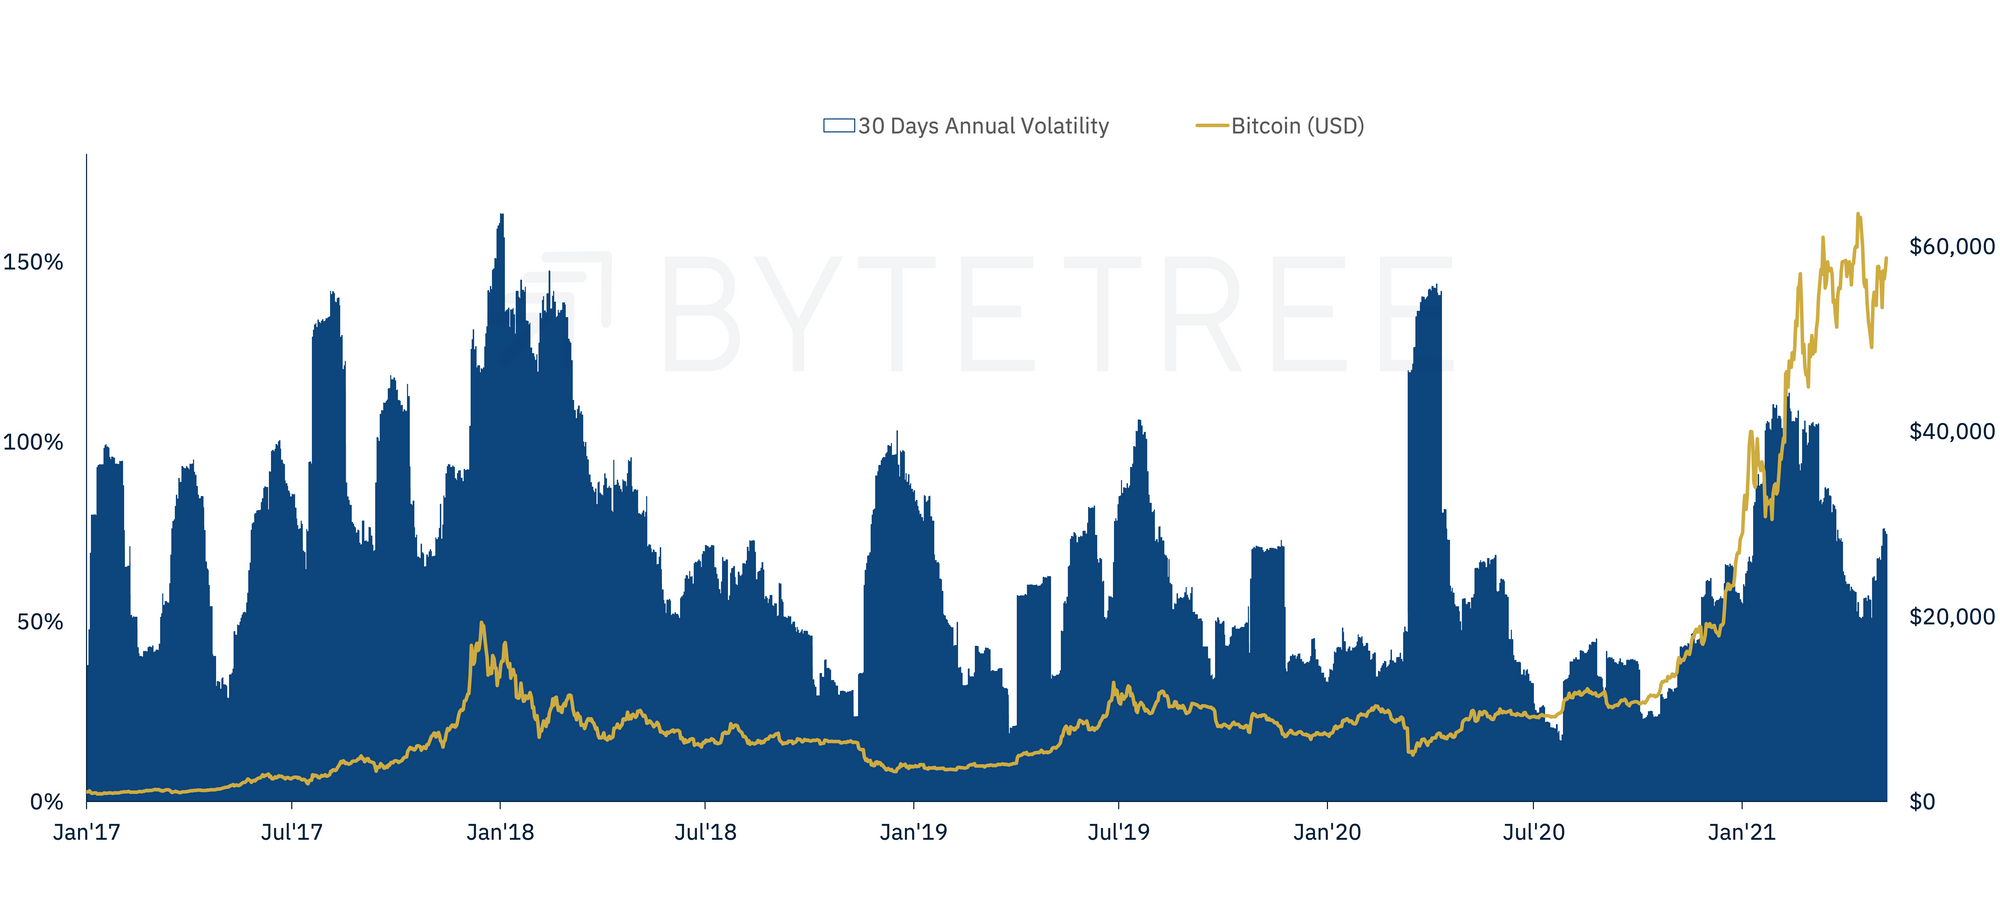
The price of bitcoin has been oscillating between $53k to $59k over the last fortnight, with volatility increasing 6%, versus last week, to a 3-month high of 75.3%.
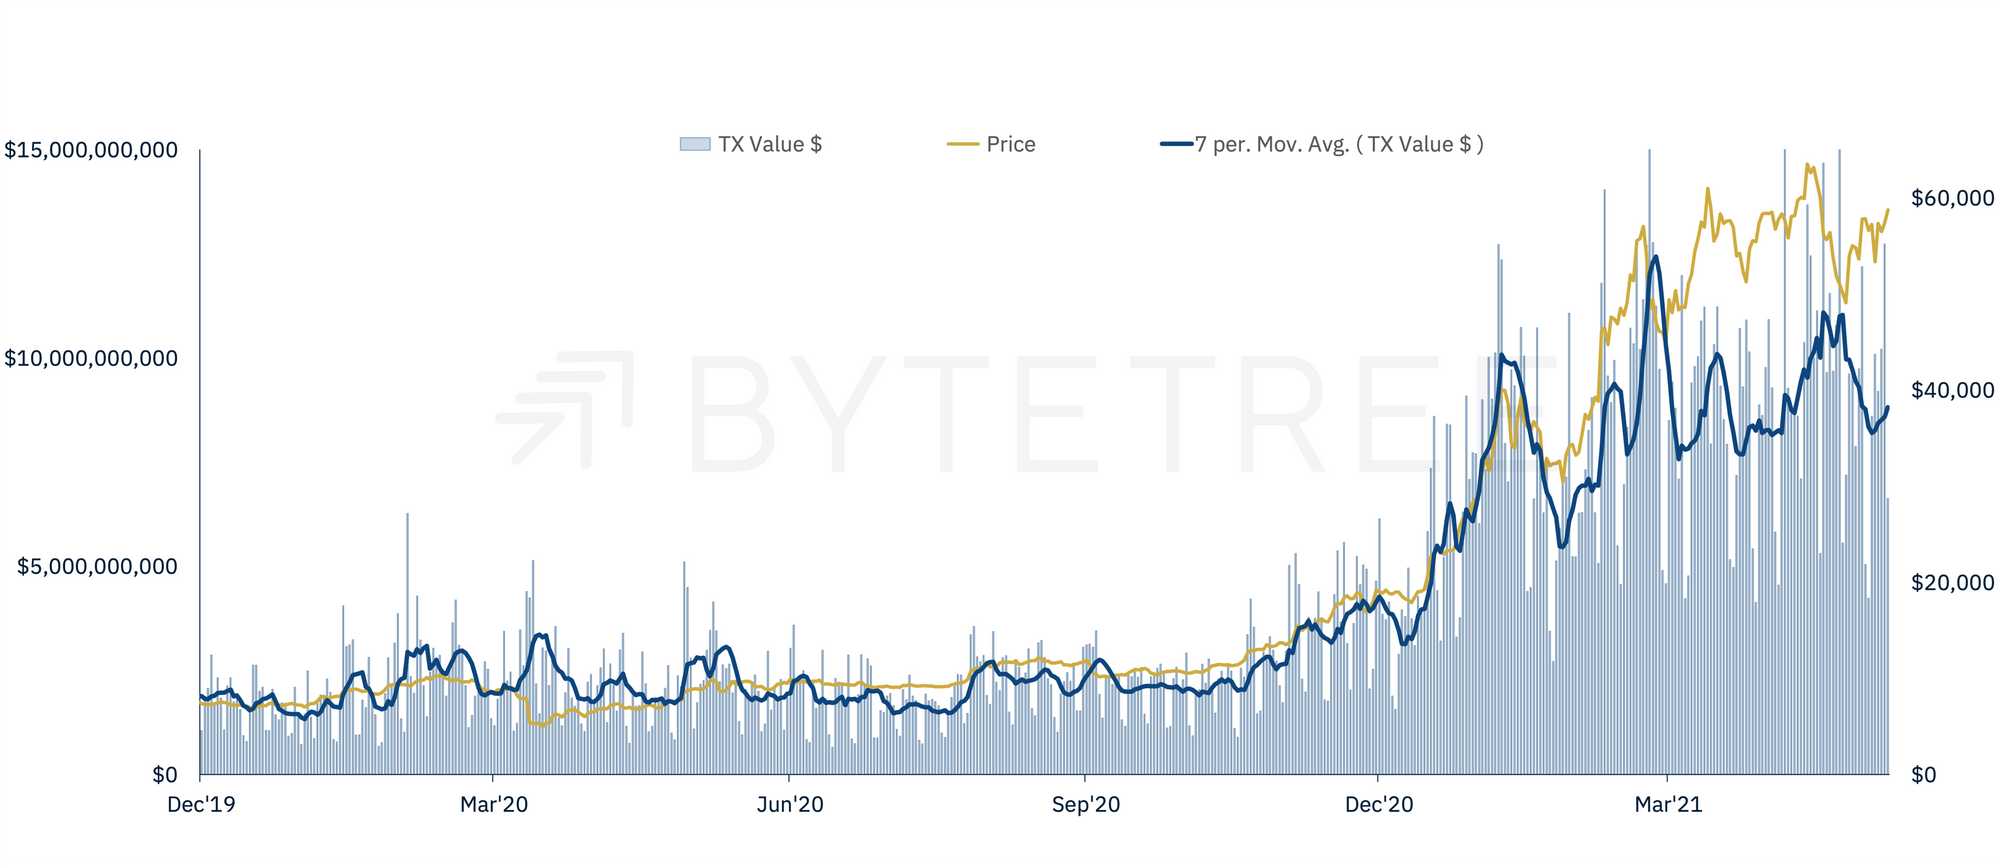
On-chain transaction value, a core measure of network demand, remains steadily above $8Bn per day. While this is approximately three times higher than the average daily TV$ in 2020, the rate of change of activity over the last few weeks sees our short-term signal move to “OFF”.
The long-term signal is currently “ON” and will require network traffic to be sustained above $8-9Bn per day over the coming weeks. On its current trajectory, we expect this signal to turn “OFF” in approximately three weeks. If the other indicators remain unchanged, this would bring us to a 2/6, signalling the end of Bitcoin’s bull market.
Short-term fees have fallen 18.5% this week to $5.3M per day, bringing the average transaction fee to 8%.
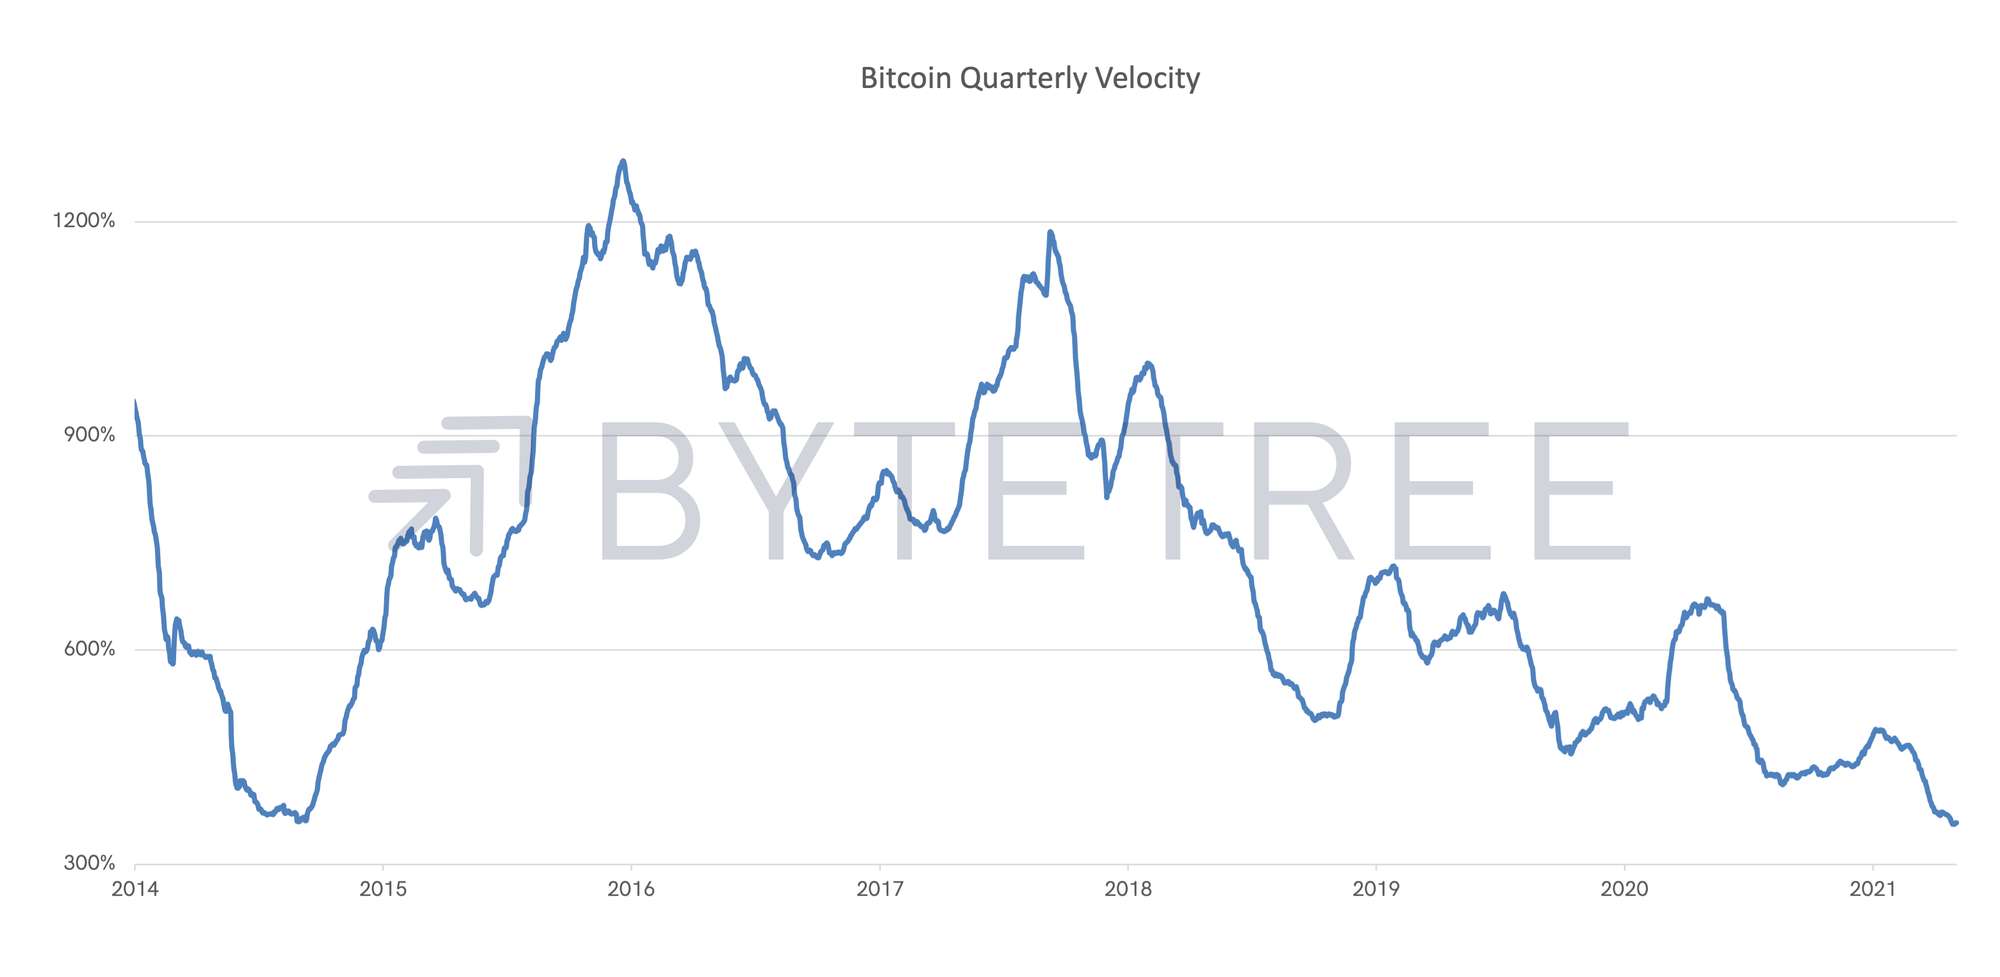
Velocity, which measures the speed at which bitcoins are moving through the economy, appears to have found a bottom around 360%. This is a level not seen since September 2014 when a bitcoin cost less than $500.
While this fall is partly structural, with a higher price per unit requiring fewer coins to be transferred to settle the same dollar amount, the rate of change indicates the growth or decline of demand for bitcoin.