

ByteTree Market Health Update; Issue 61
It has been a tough couple of weeks for Bitcoin metrics. The price has taken a knock, but the network has taken a bath. The result has seen the ByteTree Network Demand Model drop by one tick to 5 out of 6 as the short-term transaction value indicator has moved to a sell. Unless the network springs back to life, the model will keep on dropping, but will take at least a few weeks to fall to a 2 or 3, where we would naturally turn bearish.
The model is deliberately cautious and slow moving. In the unlikely event that on-chain activity slumped back to October levels, it will take time for the model to fully digest this. Nine out of ten times, that is the right approach because the data is volatile. Over emphasis on short-term moves would be detrimental. The result would see over-trading and underperformance. By taking a back seat and letting things pan out naturally, you get to differentiate between the signal and the noise.
As a result, the model was never designed to identify major tops, but to avoid lasting bear markets. It so happens that it has been pretty adapt at calling the lows. As I said, nine out of ten times, this is the right approach, with the exception being periods of extreme volatility. Over the past five years, Bitcoin price volatility has averaged 56%, which is markedly lower than the previous five years (2011 to 2016) of 73%. I am confident that the next five years will see an average closer to 40% as the market continues to mature.
Current realised volatility, measured over 30 days, has jumped to 93%, which sits within the highest decile over five years. This came about as a result of the extreme overbought reading at the $40k peak on 9th January, and the speed at which it got there. With Bitcoin severely overbought, we have deployed our alpha-seeking strategy, which is an add-on to the network demand model. This temporarily applies a shorter-term decision-making framework.
The secret sauce will not be disclosed, but volatile times require special measures. Some observations I will share include the transaction value $ (TV$), which has fallen from a record $70bn/week to $38bn/week within a short space of time, while price has held up relatedly well in comparison. Price and TV$ are normally closely aligned, so when they deviate to this degree, the risk to price increases. Other metrics we measure have shown similar weakness.
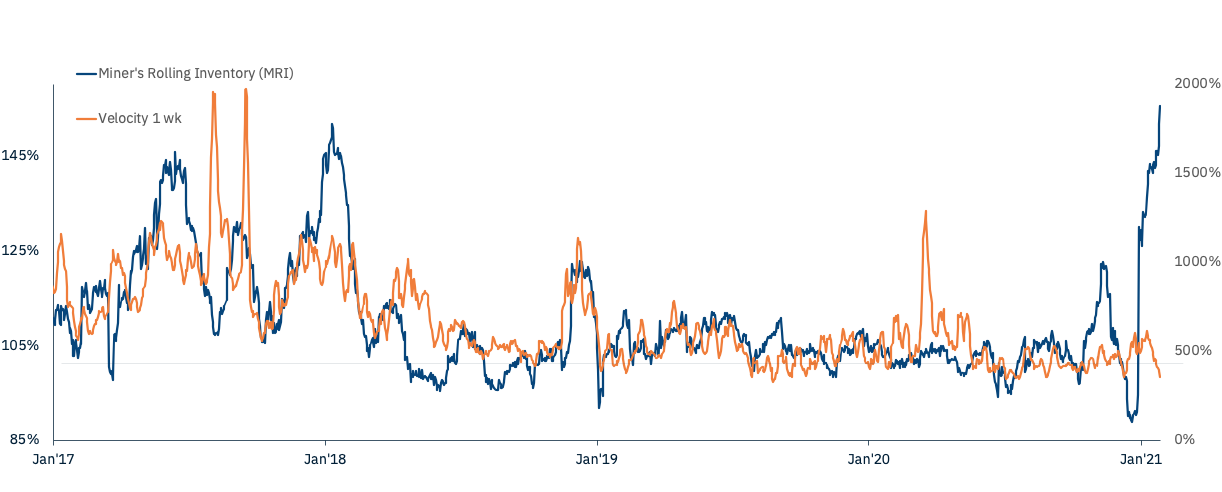
We normally point to Miners’ Rolling Inventory (MRI) as something that reflects a healthy market, as they sell into a strong bid, and hold back and accumulate when the market is soft. However, at significant market peaks, this has reversed, and the miners are dumping Bitcoin like it’s January 2018.
Heavy selling pressure from the miners
As a result of recent behaviour, we believe the risks of a price fall are heightened, while the likelihood of an imminent surge remains low. The network could start to strengthen at any time, and we will respond accordingly.


