The Flows Behind Bitcoin's All-Time-High

Disclaimer: Your capital is at risk. This is not investment advice.
ByteTree Market Health Update; Issue 54
With the price bashing $20,000, and with the narrative so strong, it is curious that Bitcoin hasn’t already spiked higher. The network is strong, and we believe it is just a matter of time.
The institutional investor has arrived. Van Eck is the latest entrant into the European ETP (nearly an ETF) market and, we welcome their arrival. They join CoinShares, 21 Shares, WisdomTree and BTCetc by HAN. Of course, we can’t forget Grayscale, the US monster that is hoovering up as many BTC as it can.
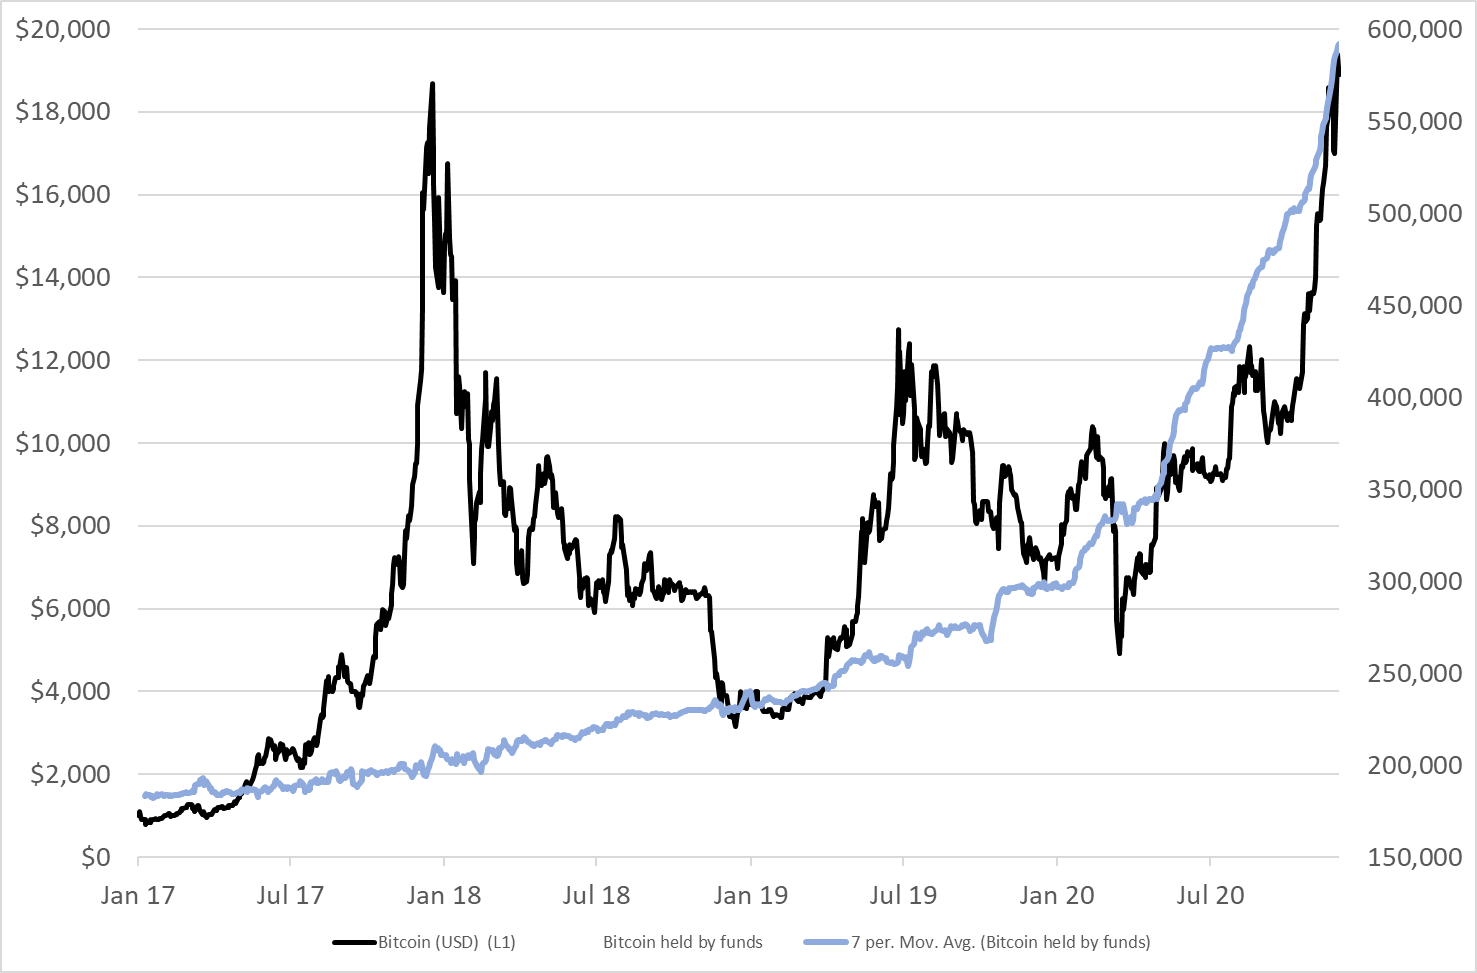
New Bitcoin products are coming to market, and investors are lapping them up. The point about these is that once they buy a bitcoin, it seems they never sell it thereafter; at least not so far. Even during the 2018 bear market, these funds held firm, even managing some modest accumulation. They now collectively hold 599,533 BTC. It is impressive. Grayscale dominate with a 90% share, but Europe is fighting back as that has fallen from 96% in Jan 2017. Go Europe!
Hotel California – Bitcoin goes into a fund, but it never leaves

More products will attract more investors, which will boost demand. Since mid-October, they have accumulated 100k BTC, which is enormous. You would think this would tighten the network, and over time, it probably will. It will be supportive for the price up to the moment that it starts to crowd out the network. With just over 3% of the total supply, there is plenty of room before that happens.
Despite this accumulation of BTC, which will fund their way into long-term cold storage, the number of BTC in circulation has remained relatively stable. We know that because it is reflected in the data. In this regard, velocity is important, because without a thriving network, there is no network effect.
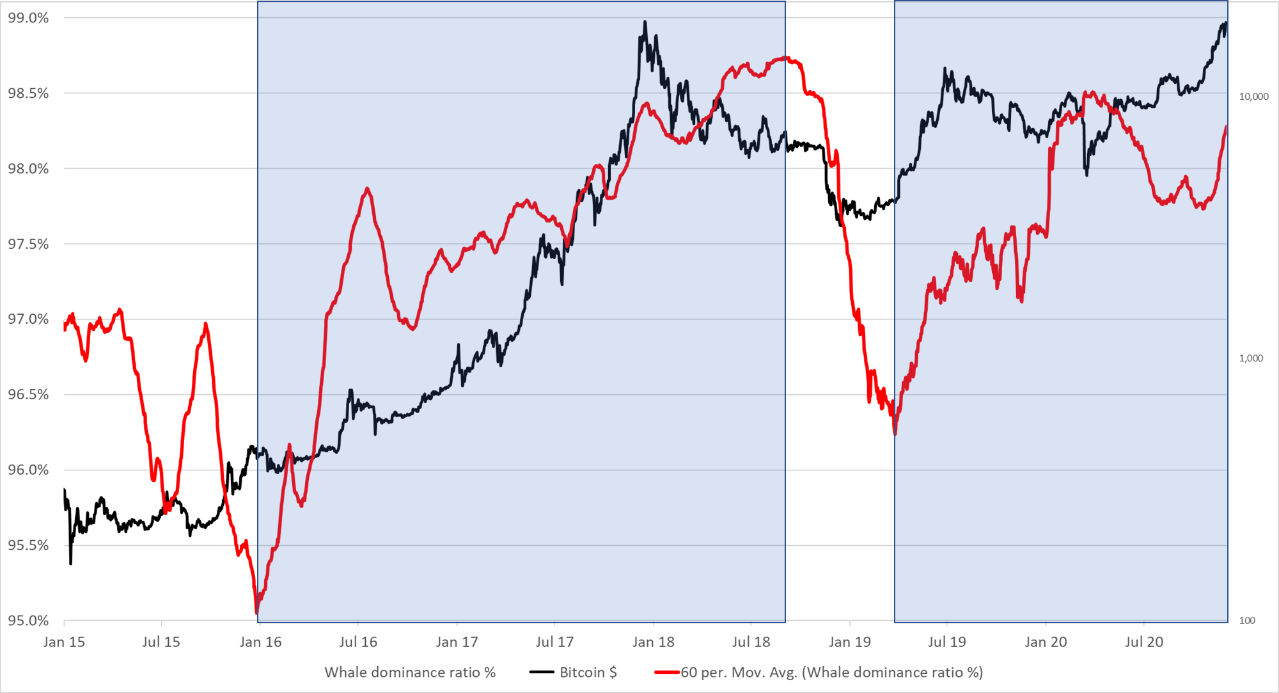
Institutional flows can be broadly measured because they show up as an increase in large transactions over normal transactions. In attempting to measure that, we compare the largest transactions by quintile, to all transactions. Unsurprisingly, the largest group have dominated the network in terms of value transfer, and they typically account for 97% or more of total network traffic.
The two blue areas show the trough to peak moves in the “institutional dominance ratio” (IDR) smoothed by a 60-day moving average. While not quite catching the price extremes, the price move between Jan 2016 and August 2018 coincided with a move from circa $500 to $5,000, before the institutional interest evaporated. The big money returned in the spring of 2019 at around $5,000 and have remained ever since. Incidentally, the quiet patch between the rising IDR periods saw institutional BTC accumulation only stall. They stopped buying for a while, but they never sold. It seems that a bitcoin that enters a fund never leaves.
Institutional dominance ratio

The IDR will no doubt improve over time as the levels and trends become clearer, as the Bitcoin network before 2016 was very different to what it is now. The major upticks in the IDR from the lows have been powerful in identifying the end of bear markets. As for the tops, it has been less useful, as it takes investors a while to let the harsh reality of a bear market sink in. Right now, IDR has turned up again, which coincides with the surge in price since mid-October, and the 100k BTC bought by funds.
As for the levels, an IDR above 98% has certainly marked newsworthy periods. That occurred at the 2017 peak and during the subsequent bear, and then again in May 2020, around the halving event. That stirred up interest despite the Covid-19 broad market sell off. It is high today, and will no doubt cool in time, but for that we need it to turn down. With so many funds spreading the word, that doesn’t seem likely anytime soon.

Comments ()