The ByteTree Track Record and Our Story So Far

Disclaimer: Your capital is at risk. This is not investment advice.
ByteTree Market Health Update; Issue 45
I first started to explore on-chain metrics in late 2013 and teamed up with Mark Griffiths to found ByteTee to learn more. I started to write about Bitcoin in Atlas Pulse in late 2013 and shared my thoughts on valuing bitcoin.
I had this idea that the Bitcoin Network could be measured in a similar way to a real-world economy and that there would be an equilibrium level of monetary velocity. Here is an extract from Atlas Pulse, published back in April 2014:
“In the USA, that monetary velocity is around 1.7 times per year. A similar study Bitcoin is, surprise, surprise… 1.7. That means a Bitcoin circulates as frequently as a dollar or, to put it another way, approximately every 200 days. This level appears to have stabilised over the past 18 months and that is why I’m guessing it has reached equilibrium. If that ratio remains broadly constant over time, the price of Bitcoin is simply a multiple of its real use.“
The idea was good, but the numbers were off because I had overestimated the size of the Bitcoin Network. In transactions, the spender receives change from the receiver, and this isn’t laid out clearly on the blockchain. You have to make assumptions, and after various iterations, we managed to solve the problem. I shared much of what I had learned with the people around me who I thought might be interested.
That backfired, as colleagues took pity on me as I told them about this new digital world. Being labelled a “bitcoiner” unquestionably bred suspicion, just as it did being a gold bull a decade earlier. Not only was I deemed to be a maverick, which I wasn’t, but the regulatory screws were tightening, and I knew it would be years before I could formally embrace digital assets on a professional level.
Leaving the old world for pastures new
Sometimes you have to make big decisions, and by 2015, I had had enough. I left my big job in fund management at HSBC for pastures new. ByteTree no longer had to remain a low-key research project, and I embraced alternative media. There were a series of lively chats on Tip TV with Zak Mir and the legendary Bill Hubbard. Here are a couple of clips from 2015/2016 when my fair value was around $700, and on-chain activity was growing rapidly. They were exciting times.

Source: Tip TV Finance. Trajectory for US rates remains upwards; The ‘doughnut factor’ in spending, Bitcoin coming of age, published 17th December 2015.

Source: Tip TV Finance. Gold on top of the commodity market, Bitcoin continuing to 697, published 25th February 2016.
I recall making noises, but few seemed to take on the message, and still aren’t particularly interested. Most people still prefer to believe weak narratives surrounding bitcoin and ignore the fundamental data-driven approach that has been working for seven years. Perhaps this is unsurprising in a world where narratives have overtaken facts, as witnessed by the valuation of the leading internet stocks.
Bitcoin is no bubble
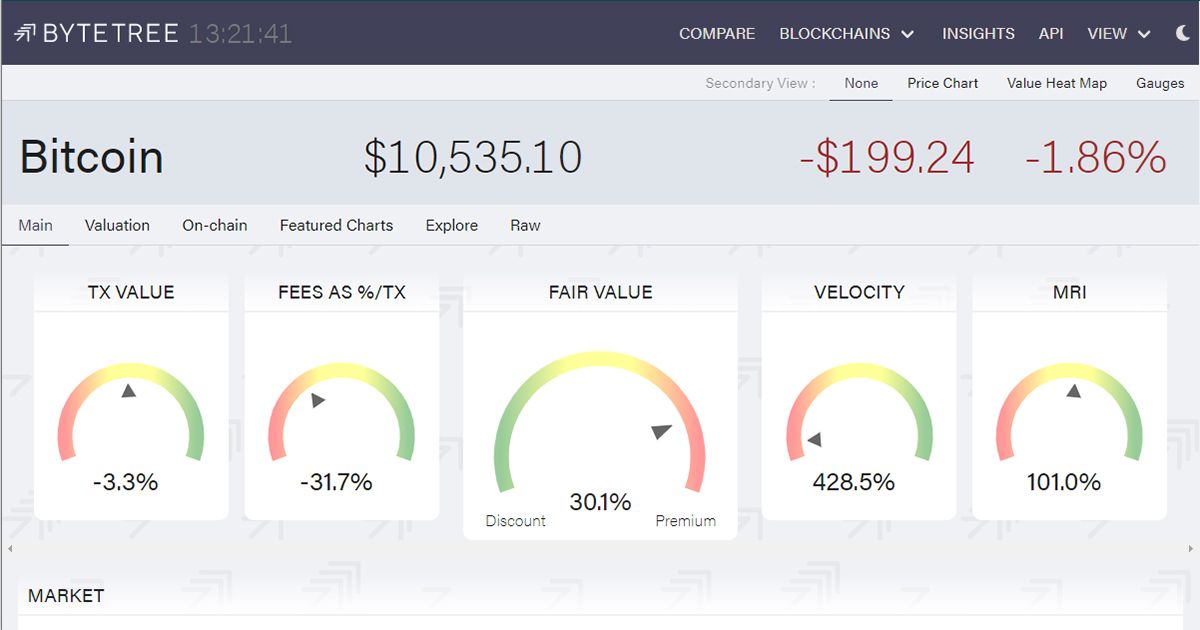
Bitcoin has links to the FANGs because it is part internet stock. However, the big difference is that it trades close to its fair value of $8,070, whereas the FANGs trade at bubble valuations. The old world of finance still chuckles disparagingly at Bitcoin yet are knee-deep in the FANGs, having slated them a decade ago. They were late to the party on gold, late on the FANGs, and will be late on Bitcoin. The old world is always fashionably late, not because they are naïve or stupid, but because they are chained and embedded in a system that resists change, especially when it comes to new asset classes they are suspicious of.
That is why it is so exciting to see the more flexible and dynamic institutional investors spearhead a move into Bitcoin. They are showing the way, which you know the old world will eventually follow, while dragging their sacks of trillions of dollars behind them. It is inevitable.
Network demand strategy track record
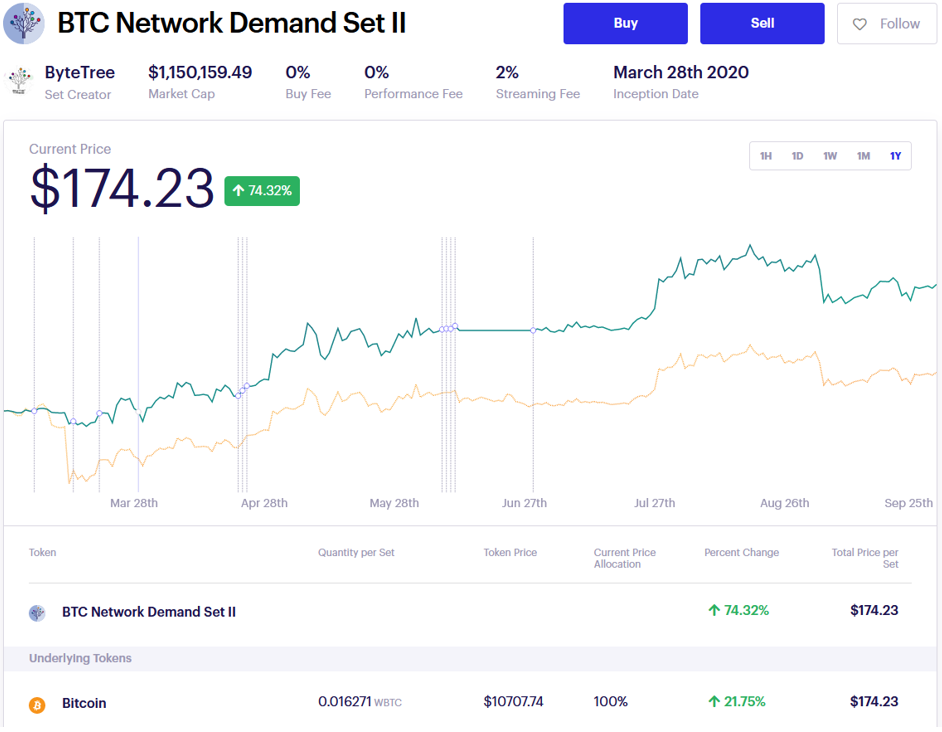
It is high time I updated you on the track record for the network demand strategy. We have been publishing the score for several months, and it has performed well. This has been recorded on Token Sets where the strategy has delivered 74% since 27th February 2020, in contrast to bitcoin’s 21.7% as seen below.

The aim is to avoid sharp drawdowns caused by on-chain weakness. Given Bitcoin has endured several near wipe-out bear markets, we believe this is the most important aim for a Bitcoin investor. By avoiding heavy losses, yet capturing the long-term gains, returns are improved significantly, with lower risk to boot.
These spectacular results are made possible by embracing an “ensemble” strategy whereby six underlying signals vote whether to be long bitcoin or sit in cash. Some signals are short-term, and others long-term, and some are linked to price while others are independent of price. That makes the strategy predominantly fundamental, yet maintaining some link to the technicals.
Technical strategies that embrace short-term signals have huge turnover, and as a result, struggle to separate the signal from the noise. Some trades will be phenomenal and others hopeless, but you can guarantee that there will be too many signals, and they will be pro-cyclical.
The beauty of the network demand strategy is that you dampen the signals and thus get rid of the noise. Bitcoin moves because of its own internal economy, and due to external influences from regulators, applications, and macroeconomics. These are generally unpredictable without inside knowledge and cannot be forecast by on-chain data. But that doesn’t matter because the only thing that truly matters is whether the Bitcoin Network will grow or not. If it does, there are huge profits to be made. And if it doesn’t, accept that nothing stands still in this world. You grow or you die, and if the latter, they’ll be a significant loss to be avoided.
Please get in touch with us at https://bytetreeam.com/ if you would like to learn more about ByteTree Asset Management.
ByteTree and Bitstamp
ByteTree will shortly release a Bitcoin report that has been sponsored by Bitstamp. It gives a comprehensive overview of the space, and we hope you like it.
ByteBox
“Please would you advise whether/when you will provide subscribers with sell/buy alerts over and above your helpful weekly report?”
We will shortly be launching a premium product that will cover a multitude of signals that we track. These will go above and beyond the network demand strategy. From that point, the network demand strategy will also become a premium product. It has been free while we have been refining various works behind the scenes. As soon as that is complete, we will let you know.
“How does the dollar index chart (DXY) impact the Bitcoin price?”
What is the dollar index? It shows the value of the US dollar in a basket of currencies. The largest constituent is the EUR (57.6%) weight, then JPY (13.6%), GBP (11.9%) etc. There are no emerging markets covered, and it basically reflects euro dollar.
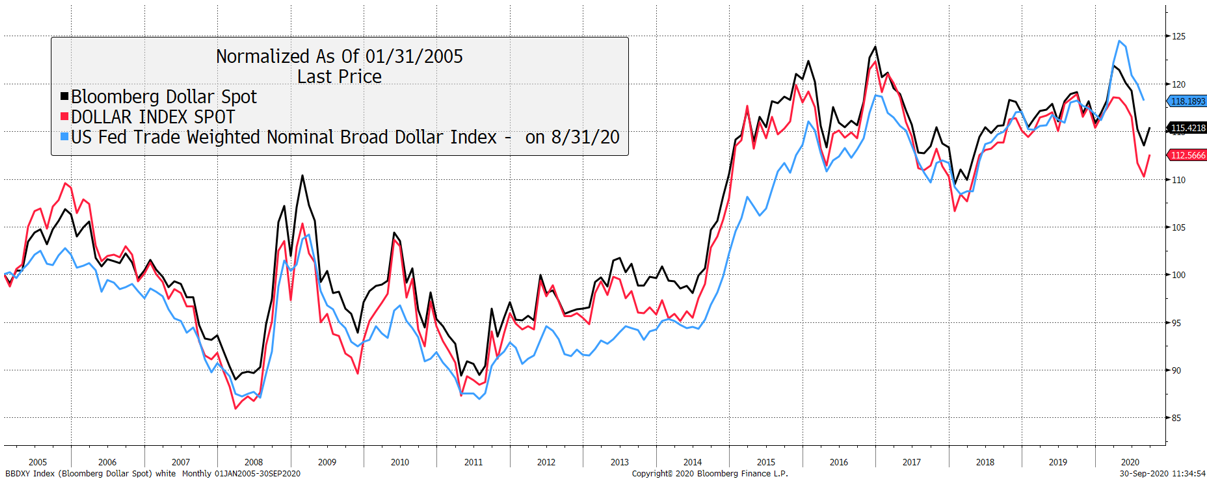
There are other dollar indices which are broader. BBDXY is the Bloomberg dollar index that is based upon their shares of international trade and FX liquidity. It is 32% EUR, 14% JPY yet has emerging exposure with 3% in CNH and INR, and 10% in MXN. There’s also the Fed’s trade-weighted index. Remarkably, they all seem to look the same despite different constituents and weights.
Dollar indices are all similar

The different dollar measures are so similar, but this is only true for the dollar. Try different methods for other currencies, and the results will be much more disperse. But since we’re talking about the dollar, the DXY will do.
The first point to notice is that the DXY hasn’t had a really large fall during Bitcoin’s lifetime. 2006/7 came before that, and 2009 to 2011 don’t really count because Bitcoin was in incubation. That means we’re only left with 2017 and post Covid-19 crash 2020. On both occasions, Bitcoin has done well. But I reiterate, we assume Bitcoin surges in a dollar bear market, but the sample size is small.
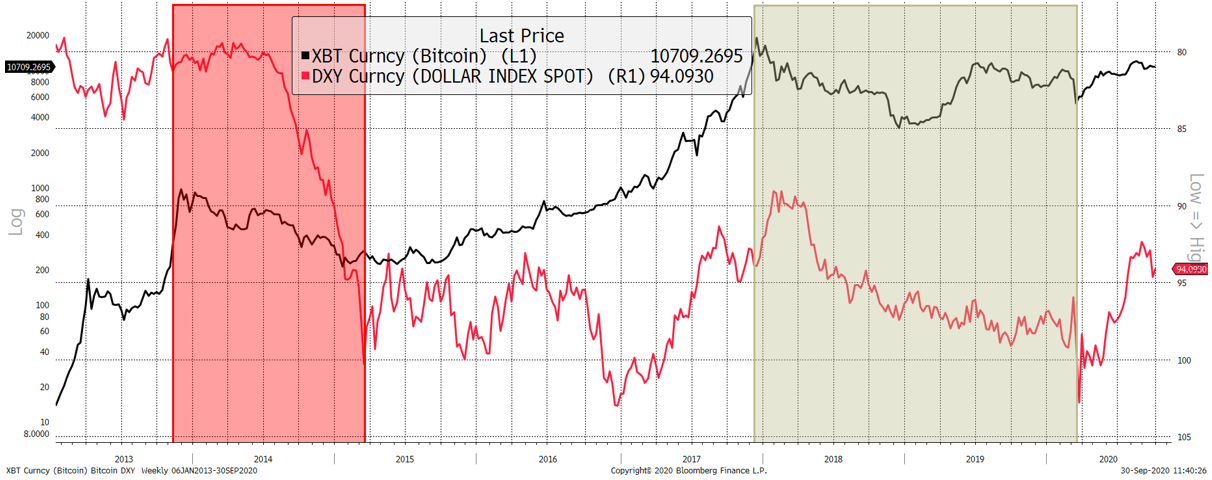
On the flip side, how did Bitcoin perform during periods of dollar strength? Here I show Bitcoin and the DXY inverted (as they then correlate), so a falling dollar becomes a rising dollar.
Bitcoin has struggled during the dollar surges

The shaded areas show periods of dollar strength (recall the line falls on an inverted axis). These both coincided with Bitcoin’s bear markets in 2014 and 2018. 2019 is shaded because the bear didn’t technically end until the Covid-19 crash in March 2020, yet 2019 was more dollar flat. The vast majority of Bitcoin’s past gains coincided with periods of a flat or weak dollar. The implication is that Bitcoin is likely to be a powerful hedge against US dollar weakness.
How likely is that? Quite likely given it is Fed policy.
Network Demand Model
The score is 4 out of 6, with velocity and short-term spend remaining bearish.

Comments ()