Prepare for a Volatility Breakout

Disclaimer: Your capital is at risk. This is not investment advice.
ByteTree Market Health Update; Issue 33
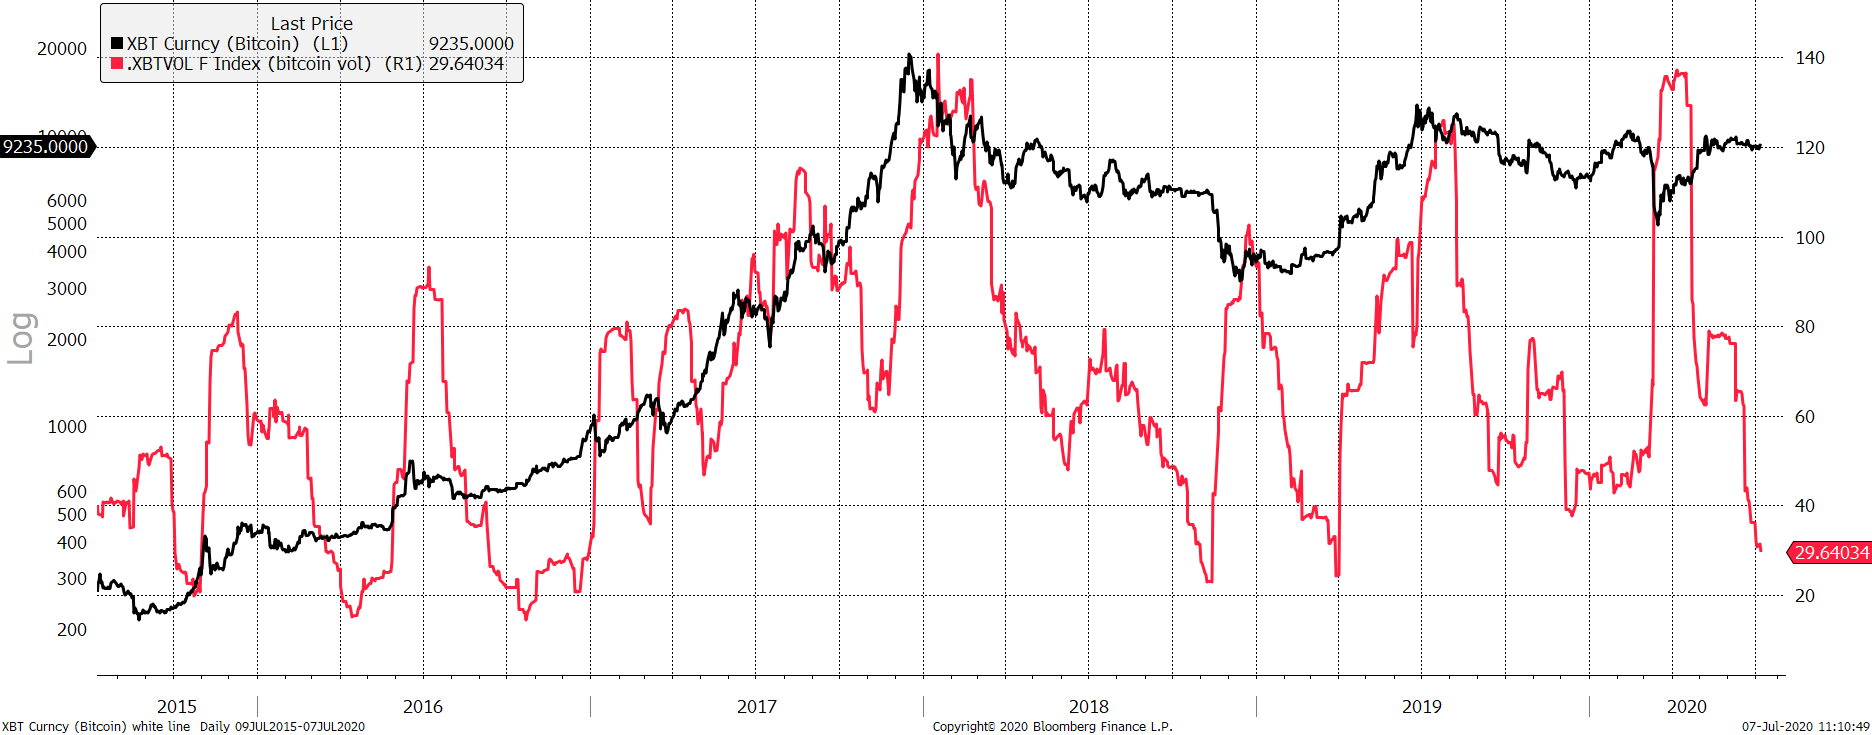
Bitcoin volatility has collapsed to 29%. Generally, that is a good thing, because it reflects a period of calm. It implies that speculators have been flushed out, and a new trend will assert itself in the not-too-distant future.
Bitcoin volatility is low

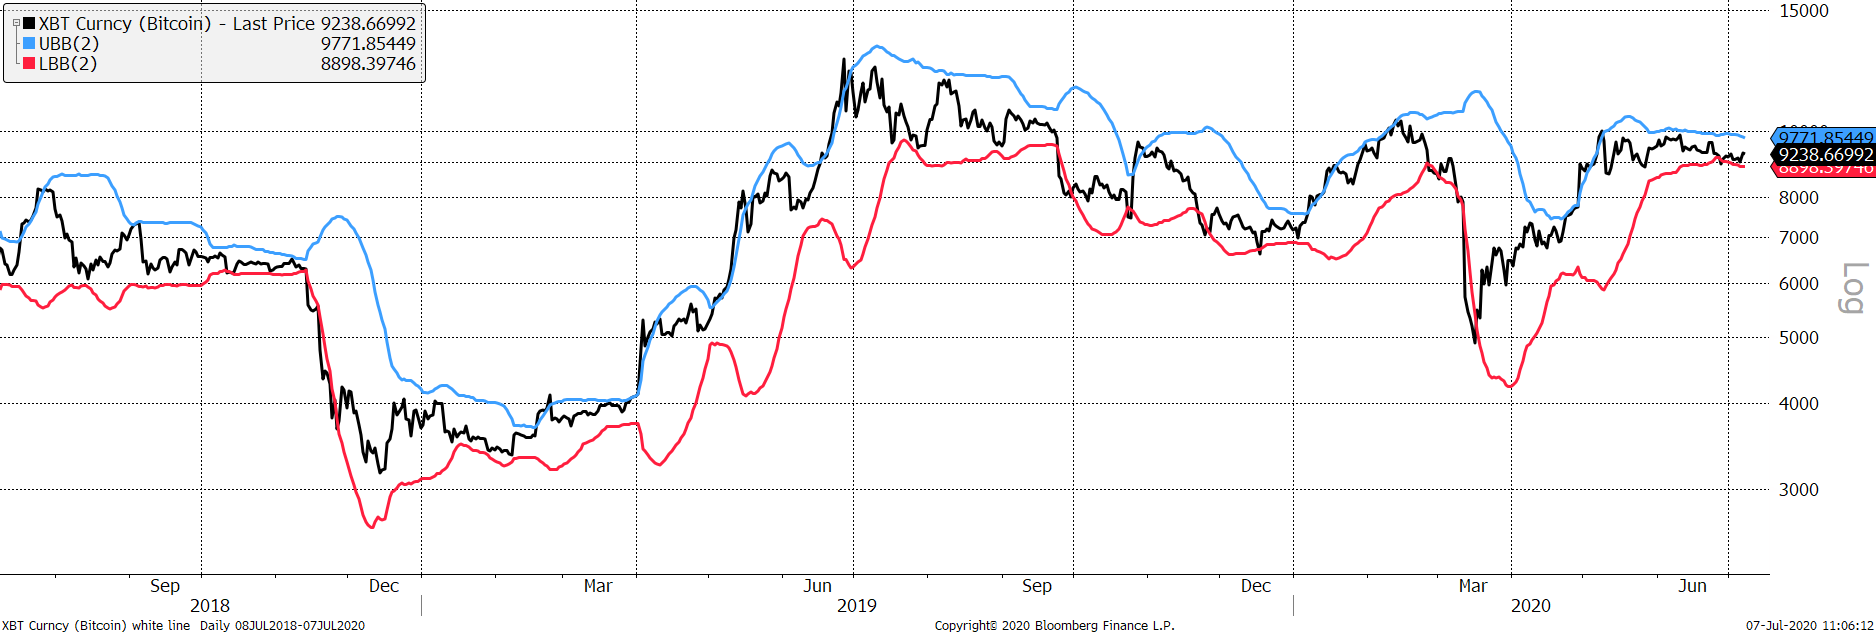
I’ll explain what volatility is in a moment, but first I wanted to show you the same information using Bollinger Bands. They measure two standard deviations over 30 days and are an alternative way to make the same point. Low volatility sees the bands close together, whereas high volatility sees them further apart.
Narrow bands

Both charts have seen powerful volatility breakouts in 2015, 2016 and 2019. There was also a breakdown in late 2018, that I’ll address.
30-day volatility, technically known as realised volatility, is a historic measure of how much a price has moved on a daily basis over the past 30 days. 29% volatility means the Bitcoin price has moved, on average by 1.8% per day (29% divided by 16%) in either direction, over the last 30 days. Here are the five best (blue) and worst (red) days over the past 30 days.
Largest moves over the past 30 days

The worst day was -5.3% and the best was 3.6%. The 20 days not shown were calm, and generally saw <1% moves. In markets, it is generally the case that most days are calm, with the large movers being outliers. Yet it is the outliers that set the volatility.
At the end of March 2020, 30-day volatility peaked at 142%, which meant the average daily moves were a staggering 8.8% (142% divided by 16%). Yet most days were between 5% and -5%. The outliers drove the volatility number.
Largest moves in March

The largest move occurred on 12 March (-27.4%) and 30 days after that, volatility dropped from 142% to 80% in a single day. It is important to understand what volatility actually is. Large moves generally don’t come out of the blue, and are preceded by a rise in volatility, which remains in place until the storm passes.
The current low levels imply a period of price consolidation, and a market balance. We know that low volatility doesn’t last forever, and so a decisive move is coming. We believe that will be upwards, but there is a risk that it could be downwards, as seen in November 2018. That was the one period of ultra-low volatility that ended in tears.
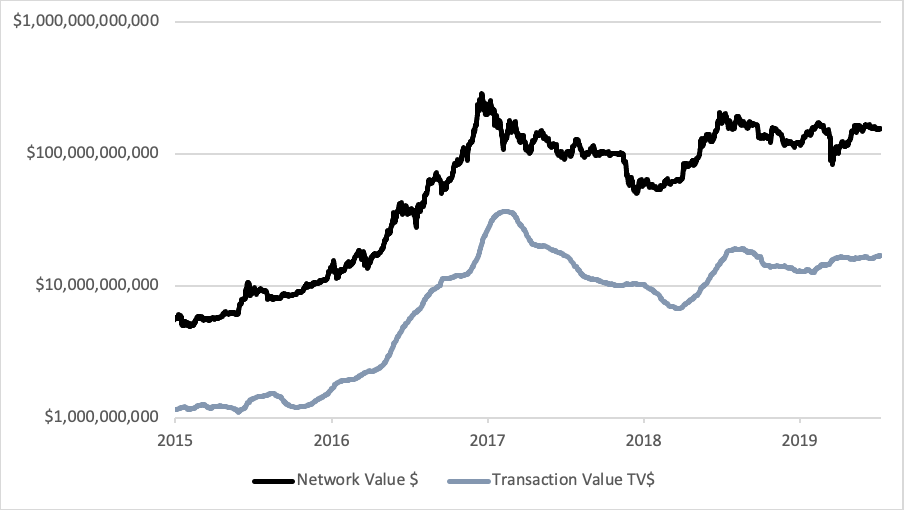
Looking at the network in 2018, it was in decline. The Average weekly network transaction value peaked at $35bn in early 2018, only to decline to $10bn by October 2018. Today, the network sees $17bn changes hands each week, and is rising slowly.
In 2018, the network was in decline but now it is stable

Furthermore, in 2018, the ByteTree fair value was $4,300 when the price was $6,300. Today the price is $9,200 when fair value is $7,200. The premium is narrow enough not to worry too much.
Low volatility doesn’t last forever, and so at some point, a breakout is inevitable. Given the underlying network is growing, albeit slowly, the odds favour a breakout to the upside.
Network demand
The current score is 4 out of 6. All the network growth indicators are positive. The Miners’ Rolling Inventory (MRI) and the velocity are below the threshold. Velocity is rising slowly.
ByteTree fundraise
I founded this company, along with the CTO Mark Griffiths some years ago. The aim was to make sense of the network by harnessing fundamental data from the blockchain. That would be hugely valuable when the institutions came to the market.
It started as a small project with one talented coder (him) and one man with a vision (me). Since 2014, we have built a large underlying infrastructure, which I see as an iceberg. What you can see on the terminal, is just the tip of what has been developed. Moreover, it is an even smaller fraction of what will be built over the coming years. It has been a long journey and ByteTree is on the cusp of great things. As a result, I will no longer be working in the old world of finance and will join ByteTree full time as the chief investment officer, while remaining chairman of the board. The timing feels right.
First, the data business will add more networks, tokens, indices, strategies, research, tools, alerts, signals, and charting tools. The next year will see progress in all of these areas, and the fundraise will further boost our development team from 3 to 5 people by the year-end. Second, we have launched ByteTree Asset Management and will launch a hedge fund in Q4.
We are currently fundraising £250,000 and are already 12% oversubscribed with an additional 20% pledged. Given the opportunity that awaits us, we have put in a hard cap at £500,000. The offer will be closed on Tuesday 21st July or when we reach the hard cap. If you would like further details please email us on investors[at]bytetree.com.
I hope you join us.
Summary
The simplest investment case for Bitcoin is that it catches on. The data shows that it is happening, and there are many reasons why that should continue. We see a healthy network, that has plenty more to give. But beyond that, we see a world that needs to replace cash, not just for privacy, but for protection from the economic madness around us. And we see a space that has a vision, that just gets better and better.
