More Alpha, Less Beta

Disclaimer: Your capital is at risk. This is not investment advice.
ByteTree Market Health Update; Issue 23
Last week, the network demand strategy briefly dipped to a score of 3 out of 6. This was because the network fees had been contracting and fell to $937,989 for the week to 14th April.
That weakness proved to be short-lived, and they have now recovered to a healthier $1,507,042. That enabled the network demand strategy to lift the score back to a 4 out of 6. With many metrics improving as we approach halving on 12th May, things are looking up.

On the topic of halving, the miners are generating fewer coins than a fortnight ago. The difficulty adjustment is designed to keep the average time between blocks at 10 minutes. That equates to a generation of 12,600 Bitcoins per week. When they mine blocks more quickly, they produce more than 12,600 Bitcoins per week and vice versa. You’ll see how the rate of Bitcoin generation leads the difficulty adjustment. In recent days, Bitcoin generation has been falling, and that means the next difficulty adjustment on the 5th May will be lower. Many associate rising difficulties to be bullish. But perhaps, if the miners are only able to generate 6,300 after halving (half of 12,600), some are pulling out of the business, as only the most efficient miners will survive. If the price fails to double, the miners’ revenue will halve.

We can’t be sure how this will be perceived by Bitcoin investors, but in our opinion, this is how the system is designed – and rightly so. If it is uneconomic to mine 6,300 Bitcoins per week at current prices, either the price must rise, or the difficulty must fall. If the price fails to rise, it will become easier to mine Bitcoins again. The important point is that the network will correct itself, halving or not.
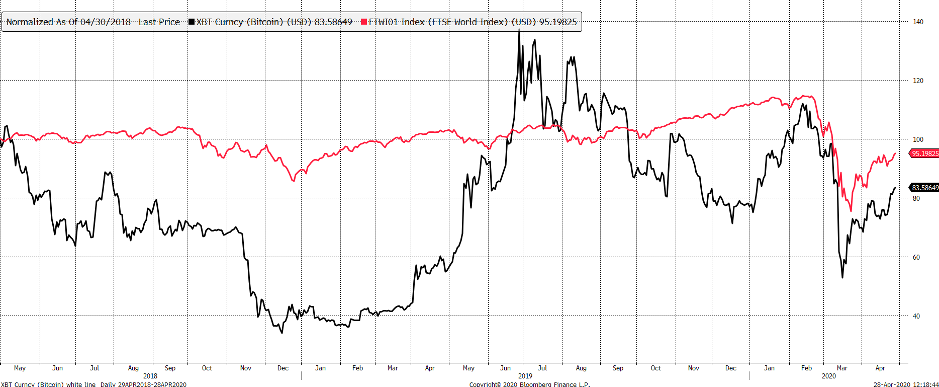
My final thought is the link between Bitcoin’s price and general asset prices. This chart shows you Bitcoin and the FTSE World Index in USD over the past two years. Bitcoin is clearly more volatile, but what strikes me is how the recent correlation has been high. The recent fall, and recovery, have been closely aligned.
Bitcoin and global equities

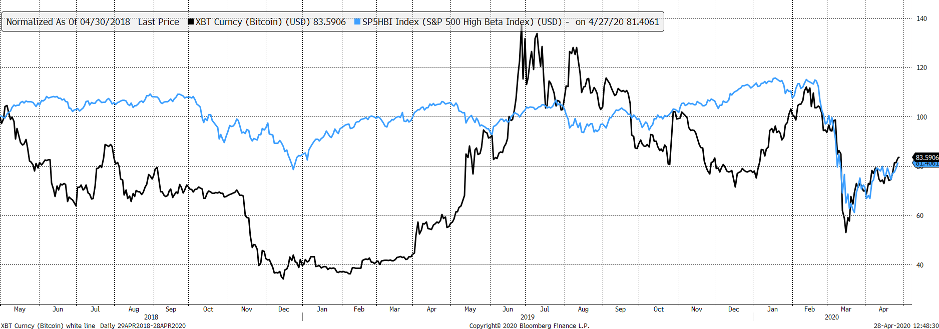
Better still is to see bitcoin against “high-beta” equities. The S&P High Beta Index focuses on companies that tend to be more speculative (the index likes semiconductors in particular). This index did particularly well in the late 1990s at the height of the dotcom boom. It fits Bitcoin quite nicely. Of course, this link may pass, but interesting nevertheless. Well, at least I thought so.
Bitcoin and beta

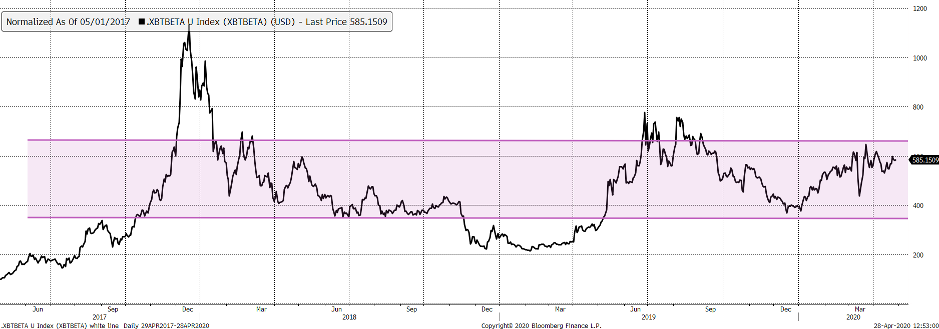
A good way to look at this relationship is with a relative chart. Bitcoin relative to high beta equities shows a narrow range compared to the past. Bitcoin beat equities in 2017, lagged in 2018, recovered in the spring of 2019, and has been finding its new place ever since. I have highlighted a range where Bitcoin has spent 62% of the time over the past three years, 72% over the past two years and 89% over the past year.
Bitcoin relative to risky equities

To become super bullish again (last time late 2015), I want to see Bitcoin break out of this range. While inside the range, Bitcoin is moving in line with both general asset prices, and more importantly, risky asset prices. It needs to be break higher, and it needs to stand out. And if it falls below the range, God help us and our vibrant virtual network.
Bitcoin needs to be more than just another way to access beta. At ByteTree, we want to see alpha.

Comments ()