
Visualising Bitcoin’s Economic Output Part II
This is the second part in a trilogy about visualising bitcoin’s economic output.
We recommend reading part I first to understand the context, which you can find here. In part two we analyse the transaction value heat maps in more detail to highlight the main types of actors contributing to the Bitcoin Economy.
Having introduced the transaction value heat maps in a previous post, let’s now take a closer look at what we are seeing. The first pattern you will notice is bright red banding through the second quartile. As the brightest area on the heat map we can interpret this as the area with the highest density of transactions. The bands that make up this quartile are transactions valued between $10 to $100.
Highest density of bitcoin payments made by retail sector
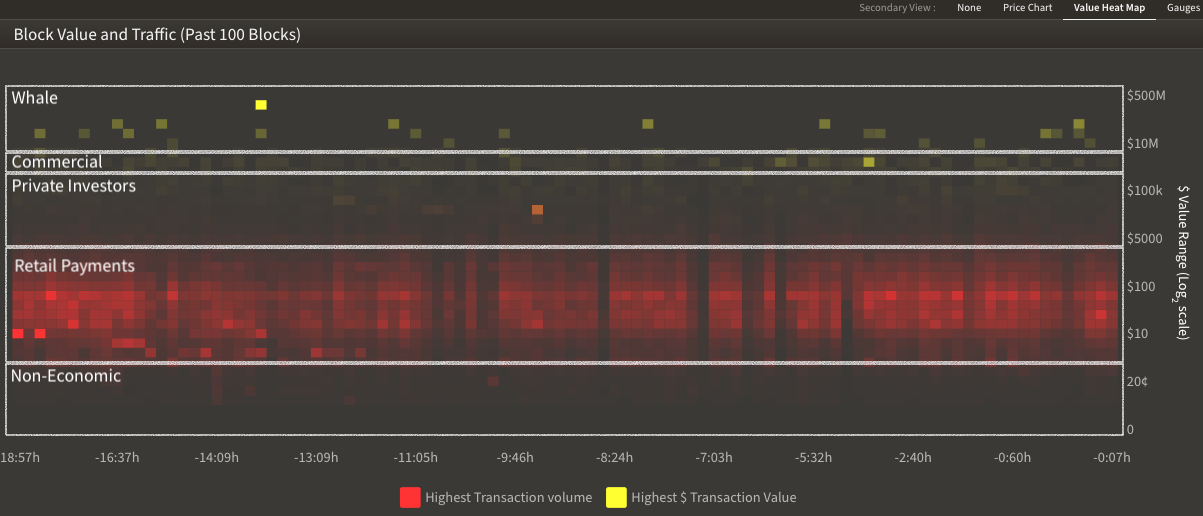
The highest density of bitcoin transactions is made at the retail payment level – between $10 to $100. This means that within a typical bitcoin block, made up of 2k transactions, around 70% or 1.4k transactions are retail.
Defining the Bitcoin Network’s key actors
Now that we have identified the highest density of transactions as retail payments, let’s take a look at the other types of actors that are likely to be on the network;
| Key Actor | Value Range | TX Density | Examples |
|---|---|---|---|
| Whale | $5M+ | Low | GrayScale, BitGo |
| Commercial | $200k - $5M | Low | OTC, BitPesa & BitPay (B2B) |
| Private investors | $1k - $200k | Mid | Small(er) crypto funds, traders |
| Retail payments | $1 - $1k | High | Wirex, Crypto.com |
| Non-economically viable (NEV) | < $1 | High | Side-chains, Layer 2 (Liqui, Tether etc.) |
Whales… is the term for bitcoin transactions over $5M. These are predominantly made up of the large institutional players in the market although can also include those big private individuals (think Winklevoss twins, Mike Novagratz etc.). When a whale transaction occurs, it is time to pay attention. While not all whale transactions go to an exchange, when they do, you will know about it!
Commercial… actors are those using the network for business purposes. This group typically operate in the range of $200k - $5M per transaction. Commercial actors could be Over-The-Counter (OTC) trading desks or smaller exchanges moving bitcoin between cold wallets, hot wallets and escrow. Business applications which use the Bitcoin Network for intracompany or B2B international transfers also fit into this category, two notable examples are BitPay and BitPesa.
Private Investors… are transactions that typically range between $1k - $200k. Transactions of this value are predominantly related to trading activity, registering on our heat map when moved from custody solutions to exchanges and vice versa.
Retail Payments… make up the most economically vibrant region of the transaction value spectrum. This region is comprised of your typical day-to-day transactions as well as lower value investments.
Transactions that are not economically viable (NEV)… are transactions of less than $1 in value. They are considered NEV since the average fee for sending a bitcoin transaction is a little over $1 (remember that the fee is $1 regardless of the value of the transaction). So why would anyone send such a transaction? While it may sound strange, bitcoin transactions can carry more than just bitcoin! There are in fact a number of applications that hitch-hike on the Bitcoin Network, including approximately $2.5Bn of the USD backed stablecoin, Tether (USDT). A NEV transaction that we see on bitcoin with a value of <$1 may in reality be carrying >$100M worth of Tether. More on this in a future post!
Summary
You can explore the transaction value heatmaps for each blockchain that we track LIVE on the ByteTree Terminal. To view them, simply click on the blockchain you want to explore and select “value heat map” from the secondary view. The heat map updates each time a new block is added to the chain. If you’d like to explore a wider time range for this data, please contact us at info@bytetree.com.
In the final part of the trilogy we will compare the economic output of leading blockchain networks to identify the differing use cases.


