The Network Value to Transaction Ratio

Disclaimer: Your capital is at risk. This is not investment advice.
The Network Value to Transaction ratio (NVT) is one of the most important metrics in valuing public blockchain networks.
The NVT measures the value of the network relative to its utility as a payment network. The ratio is derived through the following formula;
`"Network Value to Transaction Ratio (NVT)" = ("Price" xx "Adjusted Supply") / "Transaction Value (USD)"`
The network value can be likened to the market capitalisation in the traditional equities space. The NVT ratio is often referred to as the price to sales ratio for crypto-assets and is one of the most direct metrics to determine a fair value for a crypto-asset network.
Addressing the methodology
As an emerging asset class based on a public network infrastructure, there is currently no standardised approach for collecting and applying data within this model. Existing methodologies utilised by other analysts include WillyWoo and Kilichkin.
Willy Woo applies a 28-day moving average to transaction volume, taking 14 days forward and 14 days backwards facing. The output of such an analysis is of little relevance when looking for a trading signal with respect to the asset trading at a premium. Building on the efforts of Woo, Kilichkin remodelled the NVT to improve the quality of the signal. Kilichkin applied 90 days moving average data to signal overvaluation. By applying a backward-facing moving average, the output becomes more predictive, removing the time lag issue present in Woo’s model.
The ByteTree approach: NVT-BT
Our NVT-BT incorporates four improvements versus the Kilichkin method, generating the highest accuracy and greatest clarity for an overvalued signal:
- We evaluate network activity in multiples of one week periods (Eg. 7,35,91 days) to eliminate the weekday bias, where spend typically drops at weekends.
- We track NVT in weeks to provide a more intuitive output. As an example, an NVT of six weeks means the network is valued at six times its transaction volume over that period.
- We calculate network value by applying the adjusted coin count multiplied by the market price. The adjusted coin count removes around 9% of bitcoin, which has never moved from the origination address.
- Our methodology for calculating the transaction value was developed by our in-house data experts. We believe it represents one of the most accurate interpretations of real transaction value or economic output by excluding change outputs.
Interpreting the NVT
The NVT measures the network price with respect to the value of transactions it supports. If the price of the network increases while the on-chain activity remains the same, the NVT ratio increases and the market is considered to be top heavy. Similarly, if the network value falls while the transaction value remains flat, the network is tending towards fair value or becoming undervalued.
Understanding a reasonable range for the NVT is not an exact science. However, the risk to investors comes when NVT breaks sharply upwards and out of its reasonable range. At this point, the transactional activity on-jchain has grown at a slower rate than the market’s valuation of the network, and a sharp correction in network price often follows.
Why we measure the NVT in Weeks
At ByteTree, we believe that measuring the NVT in weeks is far more intuitive than a non-descript ratio. As an example, an NVT of 8 weeks means that the current network value is approximately 8x the economic output exchanged through the Bitcoin Network. As this multiple of weeks increases, the speculative premium can be considered to be increasing.
Modelling the Network Value to Transaction Ration (NVT)
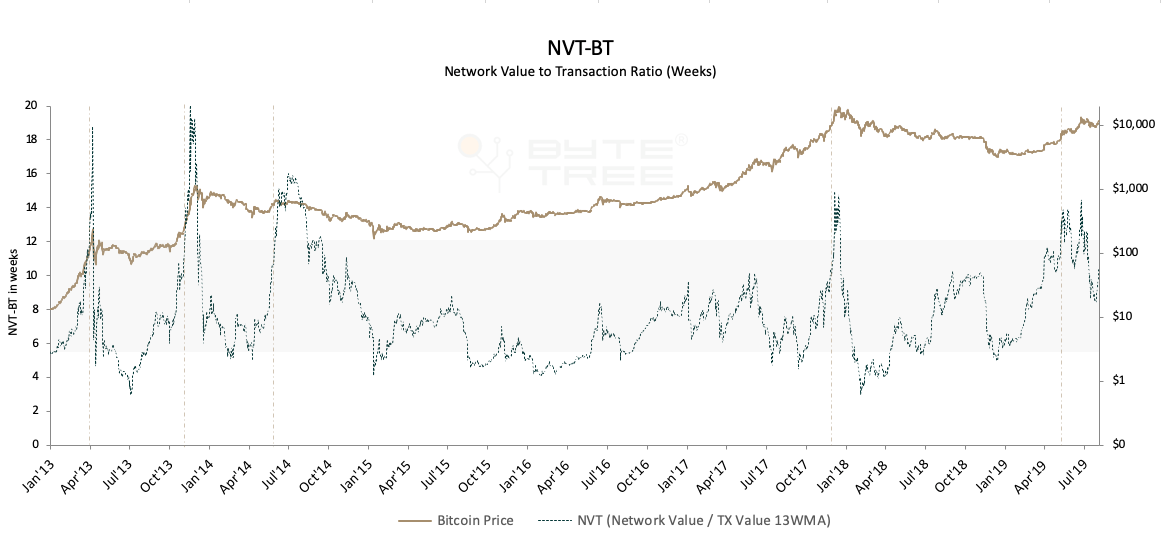
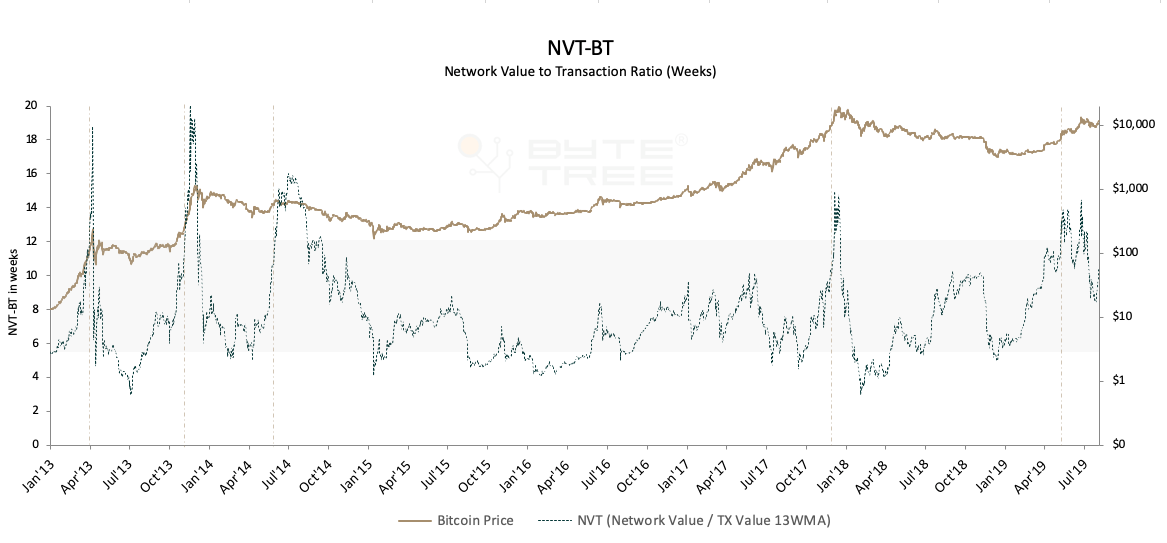
Taking the network value (price*adjusted supply) and 13 weeks moving average transaction volume, we can compute the NVT from Jan 2013 to Jul 2019. The grey highlighted area on the graph below can be considered as a normal range for NVT.

Looking at bitcoin’s historical cycles, we can identify the 12 weeks NVT as the upper bound for a reasonable range. The NVT spiked above this range in 2013, 2014 and 2017, providing approximately 5-10 days warning prior to a correction. This is indicated by the red vertical lines on the chart above.
Tracking the NVT live on the ByteTree platform
You are able to track the NVT-BT live on the ByteTree platform for all the coins that we currently support over the following time periods:

As a reminder, the shorter the time period, the more volatile the NVT reading will be. We typically look over the monthly (for shorter-term signals) and quarterly (for longer-term signals) when considering our trading positions. The graph we have shown earlier in the post uses the quarterly time frame.
