
What does history tell us about the Litecoin price?
With the Litecoin halving scheduled for Monday 5th August, what does history tell us about the Litecoin price? In this second article of the series we will look at how the Litecoin price typically moves in the run up to the halving, during the halving and following the halving.
If you haven’t already seen it, be sure to check out the introduction to this week’s series. We will be releasing an article on the Litecoin Network every day this week in the lead up the halving.
The crypto-asset market is riddled with uncertainty. With Litecoin first hitting the scene just eight years ago, it can still be considered a nascent technology. Annualized volatility typically ranges between 80% - 110% and prices are notoriously difficult to predict. At ByteTree we are using fundamental, on-chain driven analysis to aid with the price discovery of Litecoin and other UTXO crypto-assets.
While we are confident in the utility of on-chain data in interpreting price, there are certain speculative driven forces that dominate prices of key assets within this industry. Halving periods are a strong example of where the market speculates heavily on the future price of the crypto-asset.
“History doesn’t repeat itself but it often rhymes”
In our previous post we explored the dynamics behind Litecoin and the halving periods. Now, we will look at how the Litecoin price behaves around the halving.
What happened to the Litecoin price in the 2015 halving?
The last Litecoin halving occurred in August 2015 when the block reward went from 50 to 25 LTC per block mined. The chart below shows the price of Litecoin versus the inflation rate. The inflation rate is shown in two parts, generation and first spend. Some quick definitions;
- Generation – The rate new Litecoin are produced by the network, through the process of mining.
- First Spend – The rate that miners move their new Litecoin from the wallet they were mined in.
The difference between first spend and generation shows miners’ behaviour, whether they chose to sell immediately, or hold and sell in the future.
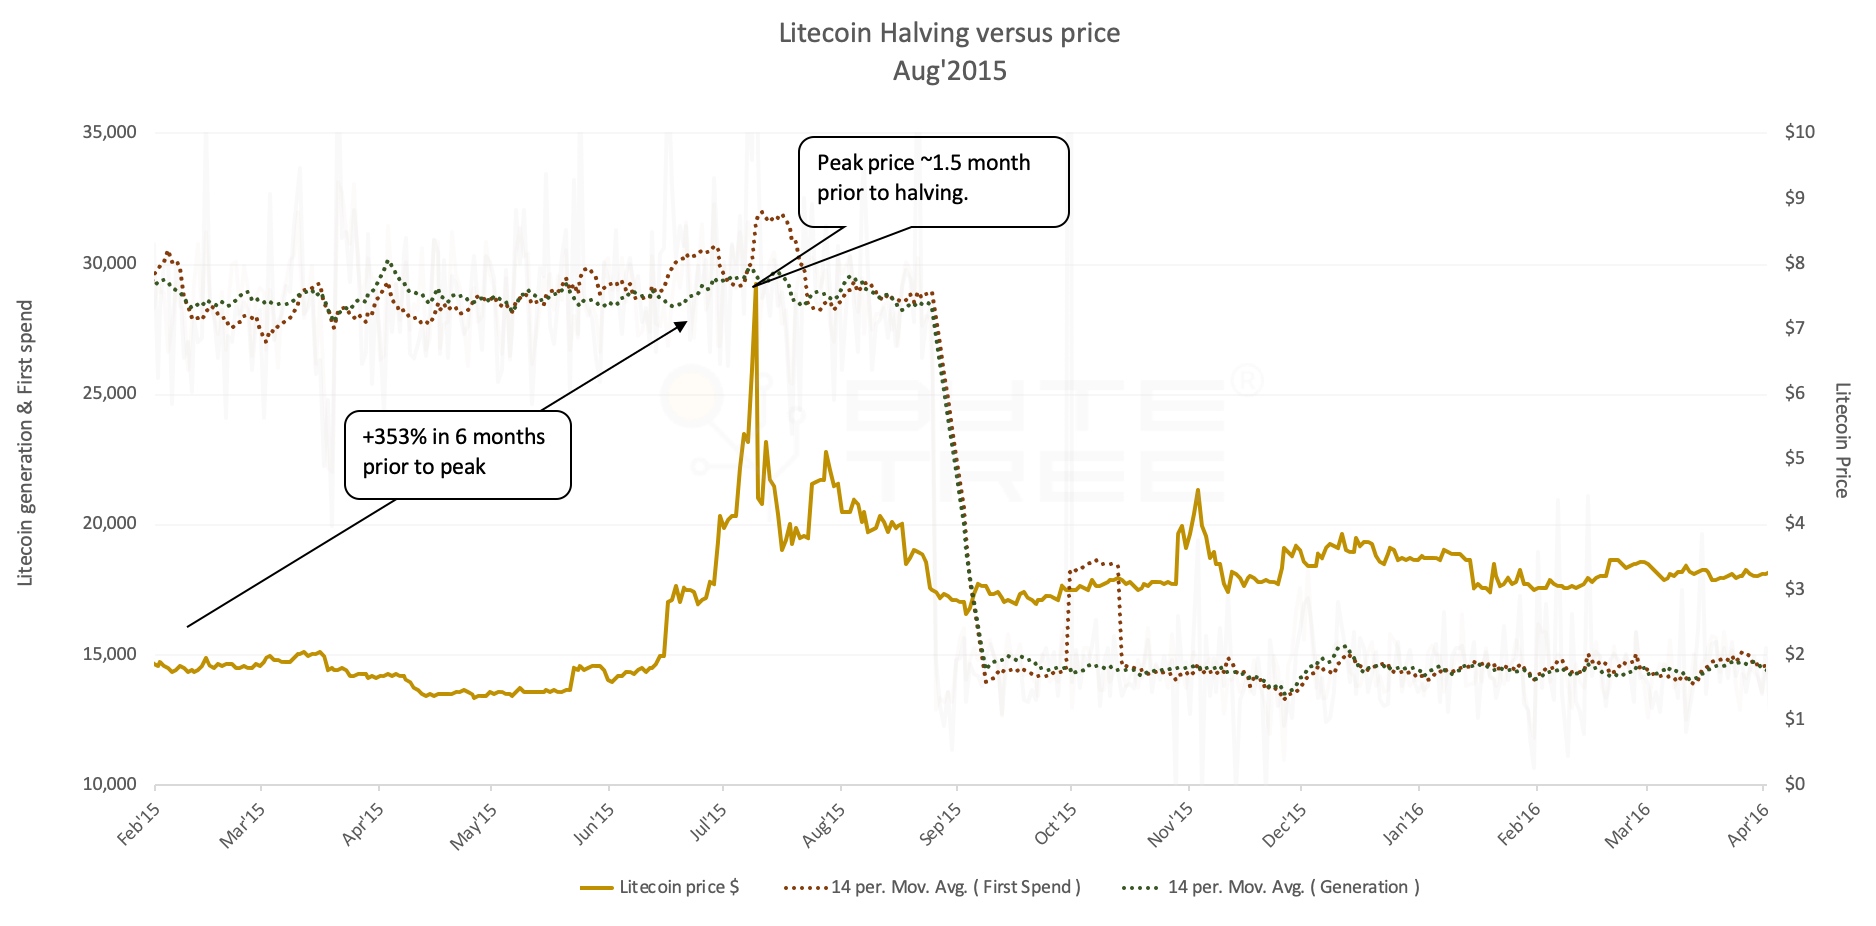
The chart above shows that the price of Litecoin increased from $1.7 to a peak of $7.7, or +353%, during the six months run up to the peak price. The peak price of $7.7 was reached approximately 1.5 months prior to the 2015 halving. Following the peak, the price fell sharply until the halving date, stabilising around the $3 mark. Looking over a 12-month window, six months either side of the halving, the total impact on price was an increase from $1.7 to $3, or +76%.
What happened to the Litecoin price during the 2019 halving?
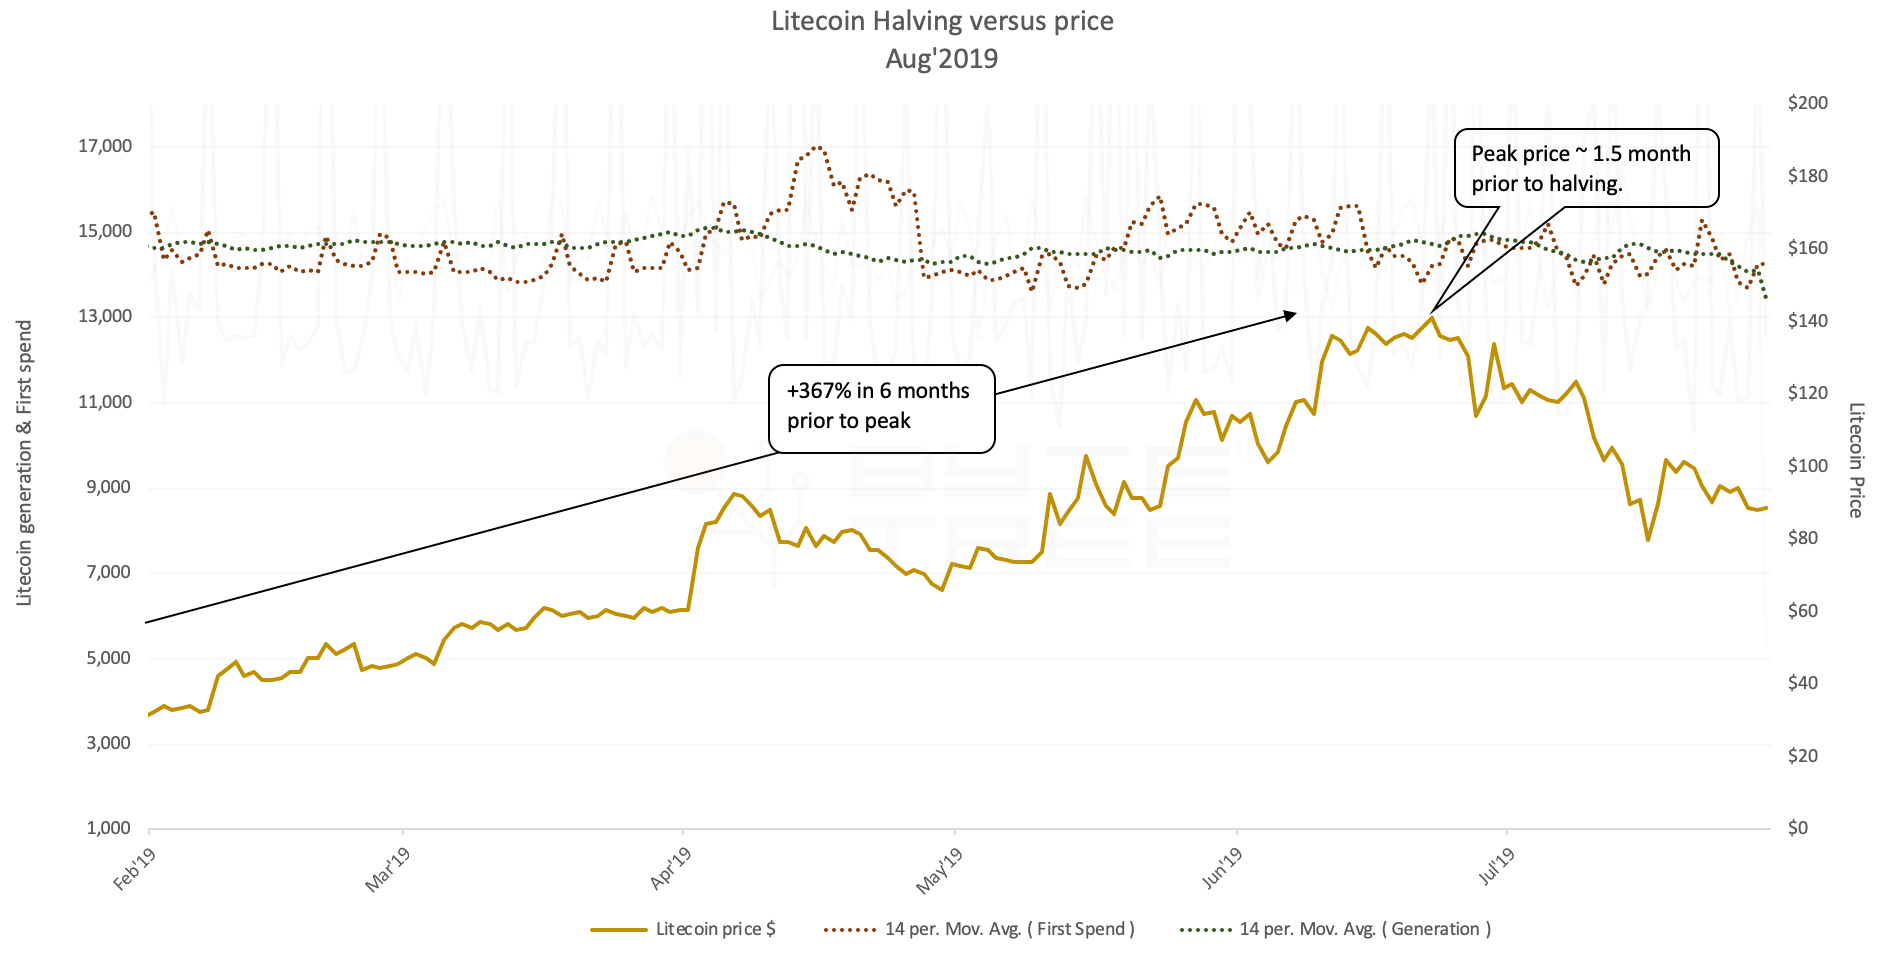
Observing the 2019 chart above, we can see a similar pattern in the run up to the current time (6 days prior to the halving). The price of Litecoin increased from $30 to $140, or +367%, during the six months run up to the peak price. The price appears to have peaked approximately 1.5 months prior to the halving date and is now on a fairly steep short-term downtrend.
Following the peak, the price fell sharply until the halving date, stabilising around the $3 mark. Looking over a 12-month window, six months either side of the halving, the total impact on price was an increase from $1.7 to $3, or +76%.
So what happens next?
Looking forward six months after the halving, if history were to repeat itself, we would expect to see a Litecoin price around $55. This is based on the 12 months price increase over the halving period of +76%.


